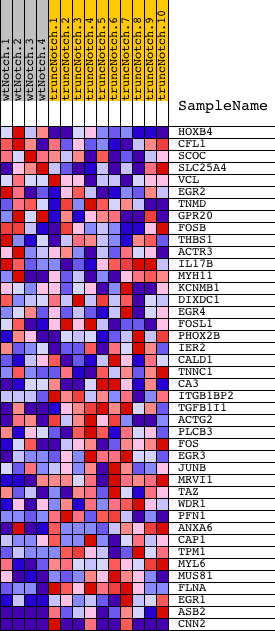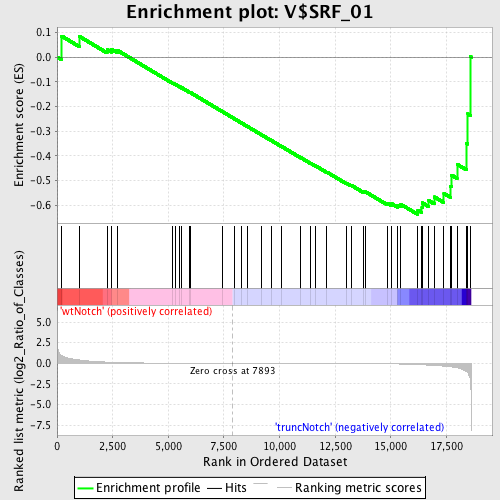
Profile of the Running ES Score & Positions of GeneSet Members on the Rank Ordered List
| Dataset | Set_03_truncNotch_versus_wtNotch.phenotype_truncNotch_versus_wtNotch.cls #wtNotch_versus_truncNotch.phenotype_truncNotch_versus_wtNotch.cls #wtNotch_versus_truncNotch_repos |
| Phenotype | phenotype_truncNotch_versus_wtNotch.cls#wtNotch_versus_truncNotch_repos |
| Upregulated in class | truncNotch |
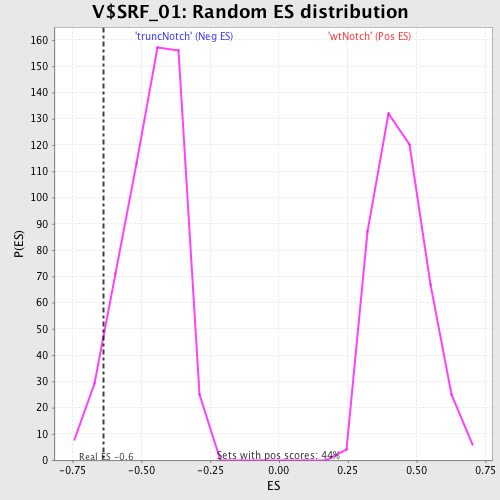
| GeneSet | V$SRF_01 |
| Enrichment Score (ES) | -0.6368626 |
| Normalized Enrichment Score (NES) | -1.3787128 |
| Nominal p-value | 0.060822897 |
| FDR q-value | 0.8253618 |
| FWER p-Value | 1.0 |
| PROBE | DESCRIPTION (from dataset) | GENE SYMBOL | GENE_TITLE | RANK IN GENE LIST | RANK METRIC SCORE | RUNNING ES | CORE ENRICHMENT | |
|---|---|---|---|---|---|---|---|---|
| 1 | HOXB4 | 540131 | 207 | 0.901 | 0.0851 | No | ||
| 2 | CFL1 | 2340735 | 1010 | 0.389 | 0.0835 | No | ||
| 3 | SCOC | 610048 2230053 | 2247 | 0.133 | 0.0311 | No | ||
| 4 | SLC25A4 | 2360519 | 2446 | 0.111 | 0.0323 | No | ||
| 5 | VCL | 4120487 | 2724 | 0.087 | 0.0268 | No | ||
| 6 | EGR2 | 3800403 | 5194 | 0.011 | -0.1050 | No | ||
| 7 | TNMD | 3060520 | 5329 | 0.010 | -0.1111 | No | ||
| 8 | GPR20 | 6620601 | 5513 | 0.009 | -0.1200 | No | ||
| 9 | FOSB | 1940142 | 5612 | 0.008 | -0.1244 | No | ||
| 10 | THBS1 | 4560494 430288 | 5957 | 0.007 | -0.1422 | No | ||
| 11 | ACTR3 | 1400497 | 6003 | 0.006 | -0.1439 | No | ||
| 12 | IL17B | 6940711 | 7435 | 0.001 | -0.2208 | No | ||
| 13 | MYH11 | 7100273 | 7968 | -0.000 | -0.2495 | No | ||
| 14 | KCNMB1 | 4760139 | 8300 | -0.001 | -0.2672 | No | ||
| 15 | DIXDC1 | 6980435 | 8564 | -0.002 | -0.2811 | No | ||
| 16 | EGR4 | 3120750 | 9179 | -0.004 | -0.3138 | No | ||
| 17 | FOSL1 | 430021 | 9620 | -0.005 | -0.3369 | No | ||
| 18 | PHOX2B | 5270075 | 10089 | -0.006 | -0.3614 | No | ||
| 19 | IER2 | 2030008 | 10960 | -0.010 | -0.4072 | No | ||
| 20 | CALD1 | 1770129 1940397 | 11382 | -0.012 | -0.4286 | No | ||
| 21 | TNNC1 | 1990575 | 11615 | -0.013 | -0.4397 | No | ||
| 22 | CA3 | 870687 5890390 | 12124 | -0.016 | -0.4653 | No | ||
| 23 | ITGB1BP2 | 6200129 | 13009 | -0.025 | -0.5102 | No | ||
| 24 | TGFB1I1 | 2060288 6550450 | 13215 | -0.028 | -0.5183 | No | ||
| 25 | ACTG2 | 4780180 | 13789 | -0.037 | -0.5452 | No | ||
| 26 | PLCB3 | 4670402 | 13869 | -0.038 | -0.5454 | No | ||
| 27 | FOS | 1850315 | 14838 | -0.065 | -0.5905 | No | ||
| 28 | EGR3 | 6940128 | 15044 | -0.073 | -0.5937 | No | ||
| 29 | JUNB | 4230048 | 15318 | -0.088 | -0.5990 | No | ||
| 30 | MRVI1 | 4810338 4850601 5900441 | 15449 | -0.096 | -0.5957 | No | ||
| 31 | TAZ | 7100193 | 16215 | -0.164 | -0.6193 | Yes | ||
| 32 | WDR1 | 1090129 3990121 | 16399 | -0.188 | -0.6091 | Yes | ||
| 33 | PFN1 | 6130132 | 16422 | -0.190 | -0.5900 | Yes | ||
| 34 | ANXA6 | 2190014 | 16704 | -0.229 | -0.5806 | Yes | ||
| 35 | CAP1 | 2650278 | 16961 | -0.267 | -0.5659 | Yes | ||
| 36 | TPM1 | 130673 | 17387 | -0.349 | -0.5515 | Yes | ||
| 37 | MYL6 | 60563 6100152 | 17688 | -0.423 | -0.5225 | Yes | ||
| 38 | MUS81 | 6660184 | 17735 | -0.442 | -0.4777 | Yes | ||
| 39 | FLNA | 5390193 | 17979 | -0.535 | -0.4337 | Yes | ||
| 40 | EGR1 | 4610347 | 18402 | -1.010 | -0.3486 | Yes | ||
| 41 | ASB2 | 4760168 | 18462 | -1.143 | -0.2298 | Yes | ||
| 42 | CNN2 | 2230433 5270446 | 18577 | -2.228 | 0.0021 | Yes |