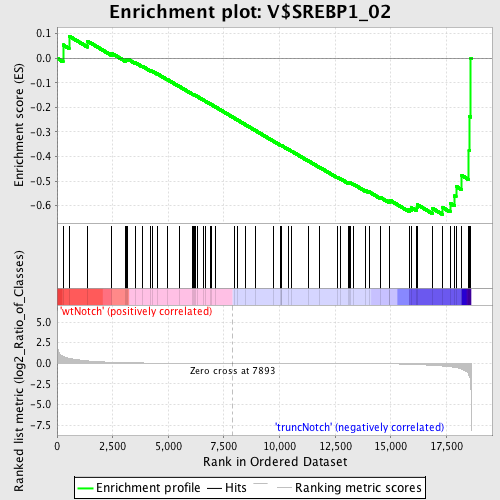
Profile of the Running ES Score & Positions of GeneSet Members on the Rank Ordered List
| Dataset | Set_03_truncNotch_versus_wtNotch.phenotype_truncNotch_versus_wtNotch.cls #wtNotch_versus_truncNotch.phenotype_truncNotch_versus_wtNotch.cls #wtNotch_versus_truncNotch_repos |
| Phenotype | phenotype_truncNotch_versus_wtNotch.cls#wtNotch_versus_truncNotch_repos |
| Upregulated in class | truncNotch |
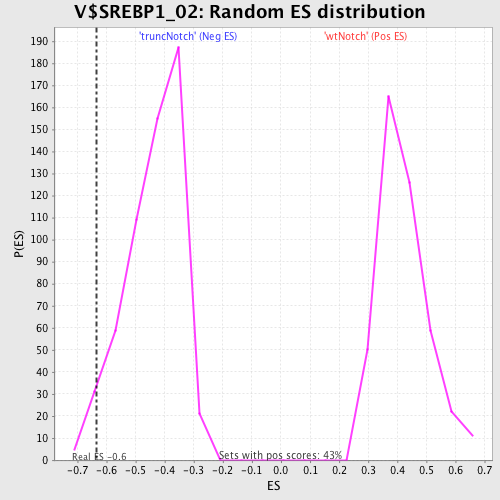
| GeneSet | V$SREBP1_02 |
| Enrichment Score (ES) | -0.63610595 |
| Normalized Enrichment Score (NES) | -1.4530063 |
| Nominal p-value | 0.029982364 |
| FDR q-value | 0.70547426 |
| FWER p-Value | 0.995 |
| PROBE | DESCRIPTION (from dataset) | GENE SYMBOL | GENE_TITLE | RANK IN GENE LIST | RANK METRIC SCORE | RUNNING ES | CORE ENRICHMENT | |
|---|---|---|---|---|---|---|---|---|
| 1 | MORF4L2 | 6450133 | 268 | 0.822 | 0.0542 | No | ||
| 2 | PTMA | 5570148 | 539 | 0.603 | 0.0901 | No | ||
| 3 | ZFYVE1 | 60440 | 1366 | 0.289 | 0.0698 | No | ||
| 4 | ELOVL5 | 3800170 | 2460 | 0.110 | 0.0201 | No | ||
| 5 | PACSIN3 | 4540369 4540400 5360037 6940129 | 3071 | 0.063 | -0.0075 | No | ||
| 6 | FBS1 | 2570520 | 3129 | 0.060 | -0.0056 | No | ||
| 7 | CHRM3 | 6110725 | 3175 | 0.056 | -0.0033 | No | ||
| 8 | BAZ2A | 730184 | 3525 | 0.041 | -0.0187 | No | ||
| 9 | YWHAE | 5310435 | 3837 | 0.030 | -0.0329 | No | ||
| 10 | NOTCH2 | 2570397 | 4202 | 0.023 | -0.0506 | No | ||
| 11 | POU4F2 | 2120195 2570022 | 4288 | 0.021 | -0.0535 | No | ||
| 12 | SREBF2 | 3390692 | 4495 | 0.018 | -0.0630 | No | ||
| 13 | WDR13 | 3840520 4670064 | 4971 | 0.013 | -0.0876 | No | ||
| 14 | ATP2B2 | 3780397 | 5480 | 0.009 | -0.1142 | No | ||
| 15 | GFAP | 2060092 | 6098 | 0.006 | -0.1469 | No | ||
| 16 | UBE2B | 4780497 | 6150 | 0.006 | -0.1492 | No | ||
| 17 | DHRS3 | 360609 | 6184 | 0.006 | -0.1505 | No | ||
| 18 | SSTR3 | 5420064 | 6211 | 0.005 | -0.1514 | No | ||
| 19 | HS6ST2 | 520133 5550603 | 6323 | 0.005 | -0.1570 | No | ||
| 20 | HYAL1 | 3850341 | 6575 | 0.004 | -0.1702 | No | ||
| 21 | PLA2G3 | 5130739 | 6690 | 0.004 | -0.1760 | No | ||
| 22 | PLAG1 | 1450142 3870139 6520039 | 6908 | 0.003 | -0.1875 | No | ||
| 23 | FGF12 | 1740446 2360037 | 6946 | 0.003 | -0.1893 | No | ||
| 24 | RBP3 | 1400059 | 7113 | 0.002 | -0.1980 | No | ||
| 25 | ZFP36L1 | 2510138 4120048 | 7959 | -0.000 | -0.2435 | No | ||
| 26 | RARA | 4050161 | 8104 | -0.001 | -0.2512 | No | ||
| 27 | TOM1L1 | 4920056 3190070 | 8488 | -0.002 | -0.2717 | No | ||
| 28 | NF1 | 6980433 | 8907 | -0.003 | -0.2940 | No | ||
| 29 | GREM1 | 3940180 | 9711 | -0.005 | -0.3369 | No | ||
| 30 | CPA4 | 3610100 | 10045 | -0.006 | -0.3543 | No | ||
| 31 | BAI3 | 940692 | 10066 | -0.006 | -0.3548 | No | ||
| 32 | PHOX2B | 5270075 | 10089 | -0.006 | -0.3555 | No | ||
| 33 | NTN4 | 6940398 | 10399 | -0.008 | -0.3715 | No | ||
| 34 | SEZ6 | 3450722 | 10535 | -0.008 | -0.3781 | No | ||
| 35 | MEF2C | 670025 780338 | 11283 | -0.011 | -0.4174 | No | ||
| 36 | DLGAP4 | 4570672 5690161 | 11785 | -0.014 | -0.4432 | No | ||
| 37 | BCL6B | 60047 | 12596 | -0.021 | -0.4851 | No | ||
| 38 | CD2AP | 1940369 | 12742 | -0.022 | -0.4911 | No | ||
| 39 | FOXP2 | 3520561 4150372 4760524 | 13106 | -0.026 | -0.5085 | No | ||
| 40 | HOXB8 | 3710450 | 13150 | -0.027 | -0.5085 | No | ||
| 41 | INPP4A | 510215 1090541 4850093 6100519 | 13170 | -0.027 | -0.5073 | No | ||
| 42 | NOL4 | 5050446 5360519 | 13315 | -0.029 | -0.5126 | No | ||
| 43 | KTN1 | 70446 3450609 4560048 | 13876 | -0.039 | -0.5396 | No | ||
| 44 | NRGN | 4280433 | 14020 | -0.041 | -0.5438 | No | ||
| 45 | KIF1C | 2480484 | 14528 | -0.055 | -0.5666 | No | ||
| 46 | DDR1 | 2060044 5220180 | 14951 | -0.069 | -0.5835 | No | ||
| 47 | HOXB1 | 2120110 | 14957 | -0.070 | -0.5779 | No | ||
| 48 | SPI1 | 1410397 | 15838 | -0.125 | -0.6149 | Yes | ||
| 49 | DPYSL2 | 2100427 3130112 5700324 | 15925 | -0.133 | -0.6084 | Yes | ||
| 50 | GNB2 | 2350053 | 16175 | -0.159 | -0.6086 | Yes | ||
| 51 | CACNA2D3 | 4010184 | 16186 | -0.161 | -0.5957 | Yes | ||
| 52 | EIF5A | 1500059 5290022 6370026 | 16867 | -0.254 | -0.6111 | Yes | ||
| 53 | LOXL1 | 3520537 | 17332 | -0.338 | -0.6079 | Yes | ||
| 54 | RAB33A | 6590195 | 17666 | -0.417 | -0.5909 | Yes | ||
| 55 | CEBPB | 2970019 | 17856 | -0.485 | -0.5606 | Yes | ||
| 56 | RHOG | 6760575 | 17932 | -0.516 | -0.5215 | Yes | ||
| 57 | POU2AF1 | 5690242 | 18189 | -0.694 | -0.4773 | Yes | ||
| 58 | NDRG2 | 450403 | 18512 | -1.446 | -0.3738 | Yes | ||
| 59 | CORO1A | 3140609 3190020 3190037 | 18548 | -1.660 | -0.2370 | Yes | ||
| 60 | GNAS | 630441 1850373 4050152 | 18597 | -2.879 | 0.0010 | Yes |