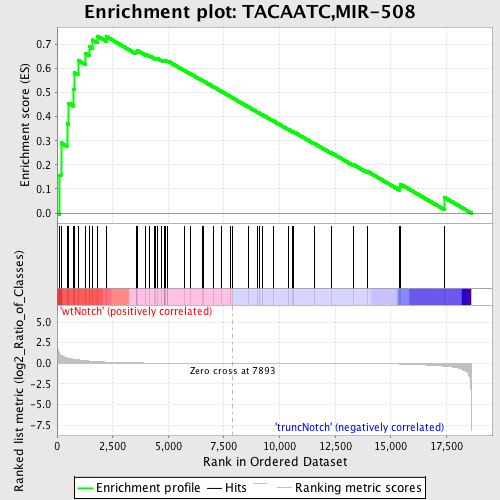
Profile of the Running ES Score & Positions of GeneSet Members on the Rank Ordered List
| Dataset | Set_03_truncNotch_versus_wtNotch.phenotype_truncNotch_versus_wtNotch.cls #wtNotch_versus_truncNotch.phenotype_truncNotch_versus_wtNotch.cls #wtNotch_versus_truncNotch_repos |
| Phenotype | phenotype_truncNotch_versus_wtNotch.cls#wtNotch_versus_truncNotch_repos |
| Upregulated in class | wtNotch |
| GeneSet | TACAATC,MIR-508 |
| Enrichment Score (ES) | 0.7343858 |
| Normalized Enrichment Score (NES) | 1.6908678 |
| Nominal p-value | 0.0023980816 |
| FDR q-value | 0.018750148 |
| FWER p-Value | 0.121 |
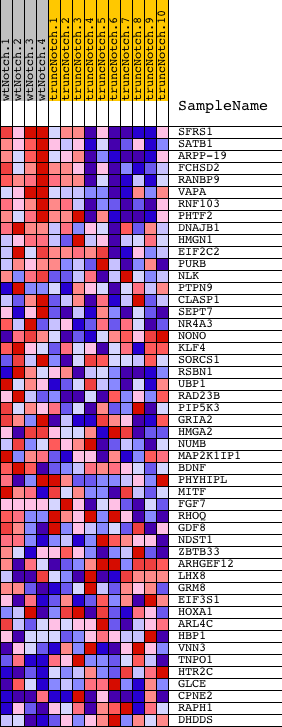
| PROBE | DESCRIPTION (from dataset) | GENE SYMBOL | GENE_TITLE | RANK IN GENE LIST | RANK METRIC SCORE | RUNNING ES | CORE ENRICHMENT | |
|---|---|---|---|---|---|---|---|---|
| 1 | SFRS1 | 2360440 | 108 | 1.134 | 0.1579 | Yes | ||
| 2 | SATB1 | 5670154 | 178 | 0.951 | 0.2913 | Yes | ||
| 3 | ARPP-19 | 5700025 | 447 | 0.654 | 0.3712 | Yes | ||
| 4 | FCHSD2 | 5720092 | 510 | 0.615 | 0.4567 | Yes | ||
| 5 | RANBP9 | 4670685 | 746 | 0.489 | 0.5146 | Yes | ||
| 6 | VAPA | 2480594 | 781 | 0.478 | 0.5818 | Yes | ||
| 7 | RNF103 | 840452 | 940 | 0.419 | 0.6338 | Yes | ||
| 8 | PHTF2 | 6590053 | 1260 | 0.320 | 0.6629 | Yes | ||
| 9 | DNAJB1 | 1090041 | 1459 | 0.264 | 0.6904 | Yes | ||
| 10 | HMGN1 | 2650026 | 1580 | 0.239 | 0.7184 | Yes | ||
| 11 | EIF2C2 | 770451 | 1811 | 0.197 | 0.7344 | Yes | ||
| 12 | PURB | 5360138 | 2214 | 0.136 | 0.7324 | No | ||
| 13 | NLK | 2030010 2450041 | 3545 | 0.040 | 0.6665 | No | ||
| 14 | PTPN9 | 3290408 | 3585 | 0.039 | 0.6700 | No | ||
| 15 | CLASP1 | 6860279 | 3615 | 0.037 | 0.6738 | No | ||
| 16 | SEPT7 | 2760685 | 3972 | 0.027 | 0.6585 | No | ||
| 17 | NR4A3 | 2900021 5860095 5910039 | 4134 | 0.024 | 0.6533 | No | ||
| 18 | NONO | 7050014 | 4395 | 0.019 | 0.6421 | No | ||
| 19 | KLF4 | 1850022 3830239 5570750 | 4424 | 0.019 | 0.6433 | No | ||
| 20 | SORCS1 | 60411 5890373 | 4533 | 0.018 | 0.6401 | No | ||
| 21 | RSBN1 | 7000487 | 4697 | 0.016 | 0.6335 | No | ||
| 22 | UBP1 | 6020707 | 4813 | 0.014 | 0.6294 | No | ||
| 23 | RAD23B | 2190671 | 4843 | 0.014 | 0.6298 | No | ||
| 24 | PIP5K3 | 5360112 | 4846 | 0.014 | 0.6318 | No | ||
| 25 | GRIA2 | 5080088 | 4853 | 0.014 | 0.6334 | No | ||
| 26 | HMGA2 | 2940121 3390647 5130279 6400136 | 4964 | 0.013 | 0.6294 | No | ||
| 27 | NUMB | 2450735 3800253 6350040 | 4974 | 0.013 | 0.6308 | No | ||
| 28 | MAP2K1IP1 | 6110091 | 5739 | 0.008 | 0.5907 | No | ||
| 29 | BDNF | 2940128 3520368 | 5977 | 0.007 | 0.5789 | No | ||
| 30 | PHYHIPL | 2360706 3840692 | 6547 | 0.004 | 0.5488 | No | ||
| 31 | MITF | 380056 | 6583 | 0.004 | 0.5475 | No | ||
| 32 | FGF7 | 5390484 | 7024 | 0.003 | 0.5242 | No | ||
| 33 | RHOQ | 520161 | 7403 | 0.001 | 0.5040 | No | ||
| 34 | GDF8 | 3850504 | 7788 | 0.000 | 0.4834 | No | ||
| 35 | NDST1 | 1500427 5340121 | 7881 | 0.000 | 0.4784 | No | ||
| 36 | ZBTB33 | 2450014 | 8617 | -0.002 | 0.4392 | No | ||
| 37 | ARHGEF12 | 3990195 | 8997 | -0.003 | 0.4192 | No | ||
| 38 | LHX8 | 5700347 | 9074 | -0.003 | 0.4156 | No | ||
| 39 | GRM8 | 4780082 | 9241 | -0.004 | 0.4072 | No | ||
| 40 | EIF3S1 | 6130368 6770044 | 9725 | -0.005 | 0.3819 | No | ||
| 41 | HOXA1 | 1190524 5420142 | 10400 | -0.008 | 0.3467 | No | ||
| 42 | ARL4C | 1190279 | 10597 | -0.008 | 0.3374 | No | ||
| 43 | HBP1 | 2510102 3130010 4210619 | 10626 | -0.009 | 0.3371 | No | ||
| 44 | VNN3 | 730053 4610609 | 11552 | -0.013 | 0.2892 | No | ||
| 45 | TNPO1 | 730092 2260735 | 12334 | -0.018 | 0.2497 | No | ||
| 46 | HTR2C | 380497 | 13329 | -0.029 | 0.2004 | No | ||
| 47 | GLCE | 4850040 | 13953 | -0.040 | 0.1726 | No | ||
| 48 | CPNE2 | 60551 | 15400 | -0.093 | 0.1081 | No | ||
| 49 | RAPH1 | 6760411 | 15436 | -0.096 | 0.1201 | No | ||
| 50 | DHDDS | 940148 6650184 | 17419 | -0.355 | 0.0645 | No |