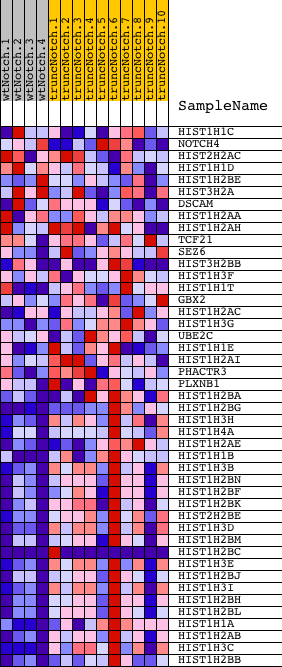
Profile of the Running ES Score & Positions of GeneSet Members on the Rank Ordered List
| Dataset | Set_03_truncNotch_versus_wtNotch.phenotype_truncNotch_versus_wtNotch.cls #wtNotch_versus_truncNotch.phenotype_truncNotch_versus_wtNotch.cls #wtNotch_versus_truncNotch_repos |
| Phenotype | phenotype_truncNotch_versus_wtNotch.cls#wtNotch_versus_truncNotch_repos |
| Upregulated in class | truncNotch |
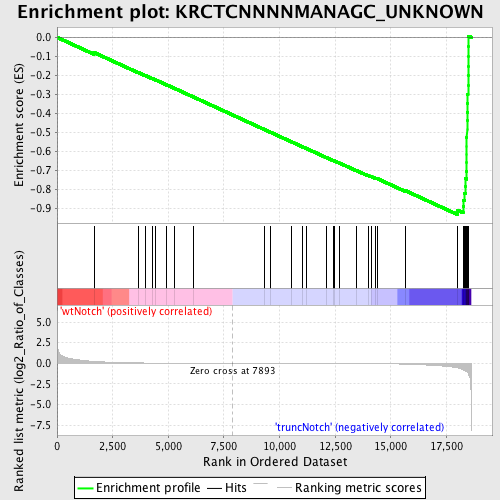
| GeneSet | KRCTCNNNNMANAGC_UNKNOWN |
| Enrichment Score (ES) | -0.9340655 |
| Normalized Enrichment Score (NES) | -2.0146465 |
| Nominal p-value | 0.0 |
| FDR q-value | 0.0 |
| FWER p-Value | 0.0 |
| PROBE | DESCRIPTION (from dataset) | GENE SYMBOL | GENE_TITLE | RANK IN GENE LIST | RANK METRIC SCORE | RUNNING ES | CORE ENRICHMENT | |
|---|---|---|---|---|---|---|---|---|
| 1 | HIST1H1C | 3870603 | 1660 | 0.224 | -0.0799 | No | ||
| 2 | NOTCH4 | 2450040 6370707 | 3659 | 0.035 | -0.1860 | No | ||
| 3 | HIST2H2AC | 2030600 | 3982 | 0.027 | -0.2022 | No | ||
| 4 | HIST1H1D | 3440446 | 4286 | 0.021 | -0.2176 | No | ||
| 5 | HIST1H2BE | 6550053 | 4439 | 0.019 | -0.2250 | No | ||
| 6 | HIST3H2A | 1580504 | 4937 | 0.013 | -0.2512 | No | ||
| 7 | DSCAM | 1780050 2450731 2810438 | 5269 | 0.011 | -0.2686 | No | ||
| 8 | HIST1H2AA | 7050100 | 6139 | 0.006 | -0.3151 | No | ||
| 9 | HIST1H2AH | 3710333 | 9334 | -0.004 | -0.4870 | No | ||
| 10 | TCF21 | 2690446 | 9607 | -0.005 | -0.5014 | No | ||
| 11 | SEZ6 | 3450722 | 10535 | -0.008 | -0.5510 | No | ||
| 12 | HIST3H2BB | 70278 | 11050 | -0.010 | -0.5782 | No | ||
| 13 | HIST1H3F | 2320441 2480022 3940170 | 11212 | -0.011 | -0.5864 | No | ||
| 14 | HIST1H1T | 130632 | 12098 | -0.016 | -0.6334 | No | ||
| 15 | GBX2 | 3940736 | 12434 | -0.019 | -0.6506 | No | ||
| 16 | HIST1H2AC | 3130292 | 12469 | -0.019 | -0.6516 | No | ||
| 17 | HIST1H3G | 5690524 | 12697 | -0.022 | -0.6629 | No | ||
| 18 | UBE2C | 6130017 | 13458 | -0.031 | -0.7025 | No | ||
| 19 | HIST1H1E | 6980706 | 13983 | -0.041 | -0.7290 | No | ||
| 20 | HIST1H2AI | 4540039 | 14108 | -0.044 | -0.7339 | No | ||
| 21 | PHACTR3 | 3850435 5900445 | 14303 | -0.048 | -0.7423 | No | ||
| 22 | PLXNB1 | 6220273 | 14380 | -0.050 | -0.7443 | No | ||
| 23 | HIST1H2BA | 2450059 | 15651 | -0.108 | -0.8081 | No | ||
| 24 | HIST1H2BG | 5670632 | 17992 | -0.538 | -0.9113 | Yes | ||
| 25 | HIST1H3H | 2760288 | 18251 | -0.776 | -0.8925 | Yes | ||
| 26 | HIST1H4A | 1940600 | 18271 | -0.814 | -0.8591 | Yes | ||
| 27 | HIST1H2AE | 4920672 | 18318 | -0.901 | -0.8236 | Yes | ||
| 28 | HIST1H1B | 1410592 | 18356 | -0.946 | -0.7856 | Yes | ||
| 29 | HIST1H3B | 4780092 | 18364 | -0.956 | -0.7456 | Yes | ||
| 30 | HIST1H2BN | 730128 | 18401 | -1.009 | -0.7050 | Yes | ||
| 31 | HIST1H2BF | 5420402 | 18411 | -1.038 | -0.6616 | Yes | ||
| 32 | HIST1H2BK | 6130433 | 18414 | -1.045 | -0.6176 | Yes | ||
| 33 | HIST2H2BE | 3360184 | 18415 | -1.046 | -0.5735 | Yes | ||
| 34 | HIST1H3D | 70687 | 18416 | -1.050 | -0.5291 | Yes | ||
| 35 | HIST1H2BM | 3170168 | 18424 | -1.060 | -0.4848 | Yes | ||
| 36 | HIST1H2BC | 2570156 6520315 | 18425 | -1.064 | -0.4399 | Yes | ||
| 37 | HIST1H3E | 840398 | 18431 | -1.073 | -0.3948 | Yes | ||
| 38 | HIST1H2BJ | 2100551 | 18448 | -1.108 | -0.3489 | Yes | ||
| 39 | HIST1H3I | 7100270 | 18457 | -1.125 | -0.3018 | Yes | ||
| 40 | HIST1H2BH | 2450039 | 18469 | -1.174 | -0.2528 | Yes | ||
| 41 | HIST1H2BL | 6380070 | 18474 | -1.185 | -0.2030 | Yes | ||
| 42 | HIST1H1A | 1450131 | 18480 | -1.204 | -0.1524 | Yes | ||
| 43 | HIST1H2AB | 2680465 | 18485 | -1.240 | -0.1003 | Yes | ||
| 44 | HIST1H3C | 730204 | 18489 | -1.250 | -0.0476 | Yes | ||
| 45 | HIST1H2BB | 1340035 | 18495 | -1.289 | 0.0065 | Yes |