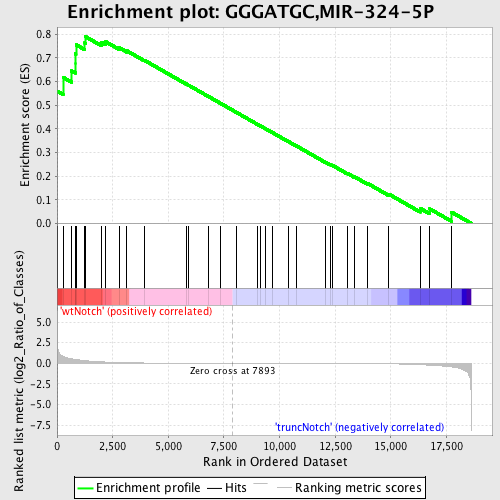
Profile of the Running ES Score & Positions of GeneSet Members on the Rank Ordered List
| Dataset | Set_03_truncNotch_versus_wtNotch.phenotype_truncNotch_versus_wtNotch.cls #wtNotch_versus_truncNotch.phenotype_truncNotch_versus_wtNotch.cls #wtNotch_versus_truncNotch_repos |
| Phenotype | phenotype_truncNotch_versus_wtNotch.cls#wtNotch_versus_truncNotch_repos |
| Upregulated in class | wtNotch |
| GeneSet | GGGATGC,MIR-324-5P |
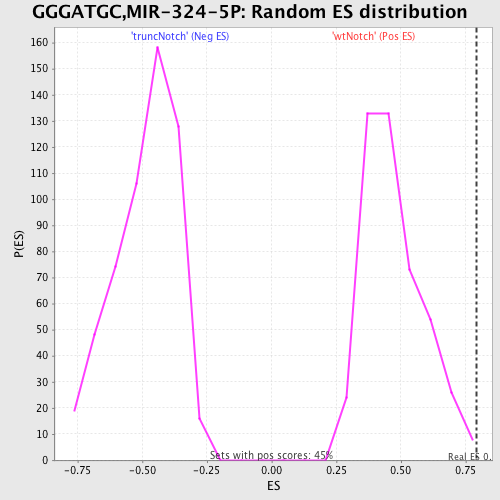
| Enrichment Score (ES) | 0.79071486 |
| Normalized Enrichment Score (NES) | 1.6781653 |
| Nominal p-value | 0.0044345898 |
| FDR q-value | 0.021832602 |
| FWER p-Value | 0.15 |
| PROBE | DESCRIPTION (from dataset) | GENE SYMBOL | GENE_TITLE | RANK IN GENE LIST | RANK METRIC SCORE | RUNNING ES | CORE ENRICHMENT | |
|---|---|---|---|---|---|---|---|---|
| 1 | ARID1A | 2630022 1690551 4810110 | 0 | 6.327 | 0.5599 | Yes | ||
| 2 | KLF3 | 5130438 | 271 | 0.818 | 0.6178 | Yes | ||
| 3 | ZFX | 5900400 | 647 | 0.540 | 0.6454 | Yes | ||
| 4 | ELAVL1 | 4730497 | 820 | 0.464 | 0.6772 | Yes | ||
| 5 | RNF44 | 5910692 | 822 | 0.461 | 0.7179 | Yes | ||
| 6 | VDAC1 | 4760059 | 850 | 0.449 | 0.7563 | Yes | ||
| 7 | AP1G1 | 2360671 | 1246 | 0.324 | 0.7636 | Yes | ||
| 8 | ING4 | 510632 2340619 2850176 5290706 | 1268 | 0.319 | 0.7907 | Yes | ||
| 9 | BBX | 6520112 | 2005 | 0.167 | 0.7659 | No | ||
| 10 | NFAT5 | 2510411 5890195 6550152 | 2188 | 0.140 | 0.7686 | No | ||
| 11 | NTRK3 | 4050687 4070167 4610026 6100484 | 2796 | 0.083 | 0.7432 | No | ||
| 12 | THRA | 6770341 110164 1990600 | 3137 | 0.059 | 0.7301 | No | ||
| 13 | RUNX2 | 1400193 4230215 | 3934 | 0.028 | 0.6898 | No | ||
| 14 | STARD13 | 540722 | 5793 | 0.007 | 0.5904 | No | ||
| 15 | BAI1 | 6350053 | 5917 | 0.007 | 0.5844 | No | ||
| 16 | RAN | 2260446 4590647 | 6795 | 0.003 | 0.5375 | No | ||
| 17 | HSPA14 | 4610487 | 7331 | 0.002 | 0.5089 | No | ||
| 18 | MAP4K3 | 5390551 | 8076 | -0.001 | 0.4689 | No | ||
| 19 | KCND2 | 1170128 2100112 | 9005 | -0.003 | 0.4192 | No | ||
| 20 | SLITRK4 | 5910022 | 9160 | -0.004 | 0.4112 | No | ||
| 21 | LMX1A | 2810239 5690324 | 9369 | -0.004 | 0.4004 | No | ||
| 22 | PBX1 | 6660301 | 9693 | -0.005 | 0.3835 | No | ||
| 23 | SEPT3 | 3830022 5290079 | 10394 | -0.008 | 0.3465 | No | ||
| 24 | UNC5C | 2640056 | 10749 | -0.009 | 0.3282 | No | ||
| 25 | CUL5 | 450142 | 12054 | -0.016 | 0.2595 | No | ||
| 26 | C1QL3 | 5420546 | 12286 | -0.018 | 0.2486 | No | ||
| 27 | UNC45B | 2470050 | 12381 | -0.019 | 0.2452 | No | ||
| 28 | SEPT4 | 1580593 | 13055 | -0.026 | 0.2113 | No | ||
| 29 | BACH2 | 6760131 | 13375 | -0.030 | 0.1968 | No | ||
| 30 | GGTL3 | 1770288 | 13951 | -0.040 | 0.1694 | No | ||
| 31 | APP | 2510053 | 14910 | -0.068 | 0.1239 | No | ||
| 32 | ZHX3 | 460615 | 16318 | -0.177 | 0.0638 | No | ||
| 33 | PCTK1 | 4560079 | 16751 | -0.236 | 0.0614 | No | ||
| 34 | SCAMP3 | 2360707 | 17731 | -0.439 | 0.0476 | No |