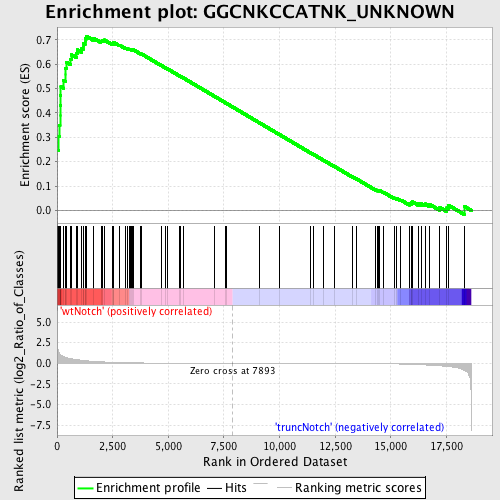
Profile of the Running ES Score & Positions of GeneSet Members on the Rank Ordered List
| Dataset | Set_03_truncNotch_versus_wtNotch.phenotype_truncNotch_versus_wtNotch.cls #wtNotch_versus_truncNotch.phenotype_truncNotch_versus_wtNotch.cls #wtNotch_versus_truncNotch_repos |
| Phenotype | phenotype_truncNotch_versus_wtNotch.cls#wtNotch_versus_truncNotch_repos |
| Upregulated in class | wtNotch |
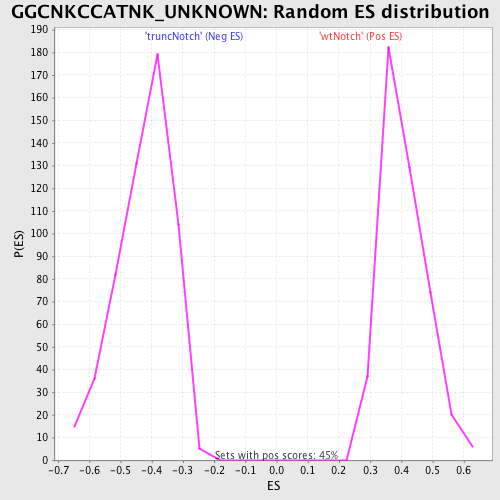
| GeneSet | GGCNKCCATNK_UNKNOWN |
| Enrichment Score (ES) | 0.71491885 |
| Normalized Enrichment Score (NES) | 1.7581795 |
| Nominal p-value | 0.0 |
| FDR q-value | 0.008491277 |
| FWER p-Value | 0.039 |
| PROBE | DESCRIPTION (from dataset) | GENE SYMBOL | GENE_TITLE | RANK IN GENE LIST | RANK METRIC SCORE | RUNNING ES | CORE ENRICHMENT | |
|---|---|---|---|---|---|---|---|---|
| 1 | ARID1A | 2630022 1690551 4810110 | 0 | 6.327 | 0.2474 | Yes | ||
| 2 | HNRPK | 1190348 2060411 2570092 6840551 | 56 | 1.549 | 0.3050 | Yes | ||
| 3 | EIF4G2 | 3800575 6860184 | 94 | 1.204 | 0.3501 | Yes | ||
| 4 | UBE4B | 780008 3610154 | 130 | 1.077 | 0.3903 | Yes | ||
| 5 | CD164 | 3830594 | 132 | 1.070 | 0.4321 | Yes | ||
| 6 | GEMIN4 | 130278 2230075 | 155 | 1.013 | 0.4705 | Yes | ||
| 7 | BRD2 | 1450300 5340484 6100605 | 172 | 0.960 | 0.5072 | Yes | ||
| 8 | SFPQ | 4760110 | 276 | 0.806 | 0.5332 | Yes | ||
| 9 | SFXN1 | 2100133 3360039 | 375 | 0.709 | 0.5556 | Yes | ||
| 10 | MCTS1 | 6130133 | 376 | 0.706 | 0.5832 | Yes | ||
| 11 | NASP | 2260139 2940369 5130707 | 411 | 0.676 | 0.6078 | Yes | ||
| 12 | CD4 | 1090010 | 607 | 0.561 | 0.6192 | Yes | ||
| 13 | RAB1A | 2370671 | 637 | 0.543 | 0.6389 | Yes | ||
| 14 | RXRB | 1780040 5340438 | 864 | 0.446 | 0.6441 | Yes | ||
| 15 | EIF4A1 | 1990341 2810300 | 907 | 0.427 | 0.6586 | Yes | ||
| 16 | ACTR8 | 4730164 | 1095 | 0.360 | 0.6626 | Yes | ||
| 17 | TOB2 | 1240465 | 1171 | 0.342 | 0.6719 | Yes | ||
| 18 | FBXO9 | 6420035 7050129 | 1178 | 0.340 | 0.6849 | Yes | ||
| 19 | BCL2L1 | 1580452 4200152 5420484 | 1257 | 0.321 | 0.6932 | Yes | ||
| 20 | OSR1 | 1500025 | 1264 | 0.319 | 0.7054 | Yes | ||
| 21 | RALA | 2680471 | 1309 | 0.304 | 0.7149 | Yes | ||
| 22 | NFYA | 5860368 | 1629 | 0.229 | 0.7067 | No | ||
| 23 | HMGN2 | 3140091 | 1972 | 0.172 | 0.6950 | No | ||
| 24 | ITCH | 1410731 5700022 | 2039 | 0.162 | 0.6977 | No | ||
| 25 | RAD21 | 1990278 | 2121 | 0.150 | 0.6992 | No | ||
| 26 | PUM1 | 6130500 | 2470 | 0.109 | 0.6847 | No | ||
| 27 | ARCN1 | 5820273 | 2536 | 0.103 | 0.6852 | No | ||
| 28 | NSD1 | 4560519 4780672 | 2542 | 0.102 | 0.6890 | No | ||
| 29 | STRN3 | 1450093 6200685 | 2806 | 0.081 | 0.6779 | No | ||
| 30 | PPP1CC | 6380300 2510647 | 3072 | 0.063 | 0.6661 | No | ||
| 31 | RPL32 | 840341 | 3170 | 0.057 | 0.6631 | No | ||
| 32 | ADAM11 | 1050008 3130494 | 3259 | 0.052 | 0.6604 | No | ||
| 33 | RPS8 | 4120136 | 3283 | 0.051 | 0.6611 | No | ||
| 34 | RPL4 | 2940014 5420324 | 3350 | 0.048 | 0.6595 | No | ||
| 35 | CRYZL1 | 730022 2320044 | 3397 | 0.046 | 0.6588 | No | ||
| 36 | EBAG9 | 5090739 7330181 | 3415 | 0.045 | 0.6596 | No | ||
| 37 | SLC39A9 | 3940348 | 3756 | 0.033 | 0.6426 | No | ||
| 38 | ARID4A | 520156 1050707 | 3806 | 0.031 | 0.6412 | No | ||
| 39 | KIF1B | 1240494 2370139 4570270 6510102 | 4683 | 0.016 | 0.5946 | No | ||
| 40 | CREB3L1 | 2350687 | 4892 | 0.014 | 0.5839 | No | ||
| 41 | WDR13 | 3840520 4670064 | 4971 | 0.013 | 0.5802 | No | ||
| 42 | TFB2M | 3830161 4670059 4760184 | 5522 | 0.009 | 0.5509 | No | ||
| 43 | HOXA2 | 2120121 | 5542 | 0.009 | 0.5502 | No | ||
| 44 | NFYC | 1400746 | 5674 | 0.008 | 0.5434 | No | ||
| 45 | ZIC3 | 380020 | 7085 | 0.002 | 0.4675 | No | ||
| 46 | HOXD4 | 5900301 | 7570 | 0.001 | 0.4414 | No | ||
| 47 | PSMD8 | 630142 | 7604 | 0.001 | 0.4396 | No | ||
| 48 | ITSN1 | 2640577 | 9086 | -0.003 | 0.3599 | No | ||
| 49 | ERH | 1770156 4570148 | 10006 | -0.006 | 0.3106 | No | ||
| 50 | PAFAH1B1 | 4230333 6420121 6450066 | 11376 | -0.012 | 0.2372 | No | ||
| 51 | ATP6V0C | 1780609 | 11525 | -0.013 | 0.2297 | No | ||
| 52 | STAG1 | 1190300 1400722 4590100 | 11972 | -0.015 | 0.2063 | No | ||
| 53 | AP4S1 | 4730292 | 12481 | -0.020 | 0.1797 | No | ||
| 54 | SYNCRIP | 1690195 3140113 4670279 | 13266 | -0.028 | 0.1385 | No | ||
| 55 | SOCS5 | 3830398 7100093 | 13454 | -0.031 | 0.1296 | No | ||
| 56 | PIGA | 1940435 5290692 | 14316 | -0.048 | 0.0851 | No | ||
| 57 | LPHN1 | 1400113 3130301 | 14414 | -0.051 | 0.0818 | No | ||
| 58 | SPRY4 | 1570594 | 14447 | -0.052 | 0.0821 | No | ||
| 59 | COL1A2 | 380364 | 14505 | -0.054 | 0.0812 | No | ||
| 60 | MATR3 | 1940170 5340278 | 14650 | -0.059 | 0.0757 | No | ||
| 61 | POU2F1 | 70577 430373 4850324 5910056 | 15161 | -0.079 | 0.0513 | No | ||
| 62 | RPS27 | 5270242 | 15264 | -0.085 | 0.0491 | No | ||
| 63 | RPL18A | 4570619 | 15452 | -0.097 | 0.0428 | No | ||
| 64 | NCOA5 | 2060647 | 15834 | -0.125 | 0.0271 | No | ||
| 65 | VAMP2 | 2100100 | 15915 | -0.131 | 0.0279 | No | ||
| 66 | DPYSL2 | 2100427 3130112 5700324 | 15925 | -0.133 | 0.0326 | No | ||
| 67 | IGF1R | 3360494 | 15971 | -0.138 | 0.0356 | No | ||
| 68 | TYRO3 | 3130193 | 16230 | -0.166 | 0.0282 | No | ||
| 69 | SLC12A8 | 4810092 | 16381 | -0.185 | 0.0273 | No | ||
| 70 | EPC1 | 1570050 5290095 6900193 | 16538 | -0.205 | 0.0269 | No | ||
| 71 | SNPH | 2680484 | 16740 | -0.234 | 0.0253 | No | ||
| 72 | SLC39A7 | 5570131 | 17201 | -0.311 | 0.0126 | No | ||
| 73 | SMYD5 | 6220025 | 17514 | -0.373 | 0.0104 | No | ||
| 74 | PDLIM2 | 2450603 2810551 3830040 4670164 | 17597 | -0.395 | 0.0214 | No | ||
| 75 | RGS3 | 60670 540736 1340180 1500369 3390735 4010131 4610402 6380114 | 18298 | -0.857 | 0.0172 | No |