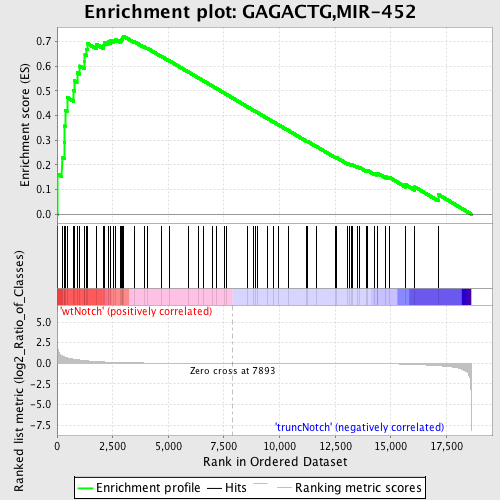
Profile of the Running ES Score & Positions of GeneSet Members on the Rank Ordered List
| Dataset | Set_03_truncNotch_versus_wtNotch.phenotype_truncNotch_versus_wtNotch.cls #wtNotch_versus_truncNotch.phenotype_truncNotch_versus_wtNotch.cls #wtNotch_versus_truncNotch_repos |
| Phenotype | phenotype_truncNotch_versus_wtNotch.cls#wtNotch_versus_truncNotch_repos |
| Upregulated in class | wtNotch |
| GeneSet | GAGACTG,MIR-452 |
| Enrichment Score (ES) | 0.7216642 |
| Normalized Enrichment Score (NES) | 1.7317103 |
| Nominal p-value | 0.0 |
| FDR q-value | 0.011587766 |
| FWER p-Value | 0.059 |
| PROBE | DESCRIPTION (from dataset) | GENE SYMBOL | GENE_TITLE | RANK IN GENE LIST | RANK METRIC SCORE | RUNNING ES | CORE ENRICHMENT | |
|---|---|---|---|---|---|---|---|---|
| 1 | CNOT7 | 2450338 5720397 | 23 | 1.857 | 0.1627 | Yes | ||
| 2 | TCF12 | 3610324 7000156 | 219 | 0.880 | 0.2299 | Yes | ||
| 3 | RHOT1 | 6760692 | 327 | 0.763 | 0.2916 | Yes | ||
| 4 | GTF2E1 | 4070014 | 338 | 0.752 | 0.3575 | Yes | ||
| 5 | PPP2CA | 3990113 | 361 | 0.725 | 0.4203 | Yes | ||
| 6 | OGT | 2360131 4610333 | 449 | 0.653 | 0.4734 | Yes | ||
| 7 | RORC | 1740121 | 744 | 0.490 | 0.5008 | Yes | ||
| 8 | MAPK6 | 6760520 | 787 | 0.477 | 0.5406 | Yes | ||
| 9 | ADIPOR2 | 1510035 | 895 | 0.433 | 0.5730 | Yes | ||
| 10 | PAIP2 | 4210441 | 1019 | 0.387 | 0.6006 | Yes | ||
| 11 | TCF4 | 520021 | 1228 | 0.328 | 0.6183 | Yes | ||
| 12 | RAB35 | 630056 | 1251 | 0.322 | 0.6456 | Yes | ||
| 13 | BCAS3 | 4050647 | 1333 | 0.299 | 0.6676 | Yes | ||
| 14 | CDC42EP3 | 2480138 | 1355 | 0.292 | 0.6923 | Yes | ||
| 15 | SP1 | 6590017 | 1778 | 0.205 | 0.6876 | Yes | ||
| 16 | HIP2 | 2810095 3990369 4120301 | 2083 | 0.155 | 0.6849 | Yes | ||
| 17 | LDB1 | 5270601 | 2122 | 0.150 | 0.6960 | Yes | ||
| 18 | SLC6A9 | 2470520 | 2289 | 0.128 | 0.6984 | Yes | ||
| 19 | TCF20 | 1190338 1240520 4070594 4810440 | 2394 | 0.117 | 0.7031 | Yes | ||
| 20 | ZDHHC5 | 1690711 | 2523 | 0.104 | 0.7053 | Yes | ||
| 21 | PPP1R12A | 4070066 4590162 | 2639 | 0.094 | 0.7074 | Yes | ||
| 22 | MOBKL2B | 940128 | 2856 | 0.078 | 0.7027 | Yes | ||
| 23 | P4HA1 | 2630692 | 2896 | 0.075 | 0.7072 | Yes | ||
| 24 | DYRK1A | 3190181 | 2922 | 0.073 | 0.7123 | Yes | ||
| 25 | RAB8B | 510692 1980017 3130136 4570739 | 2956 | 0.071 | 0.7168 | Yes | ||
| 26 | EN1 | 5360168 7050025 | 2979 | 0.069 | 0.7217 | Yes | ||
| 27 | CALU | 2680403 3520056 4610348 5720176 6130121 | 3471 | 0.043 | 0.6990 | No | ||
| 28 | TNRC15 | 6760746 | 3907 | 0.029 | 0.6781 | No | ||
| 29 | PRRX1 | 4120193 4480390 | 4054 | 0.025 | 0.6725 | No | ||
| 30 | RSBN1 | 7000487 | 4697 | 0.016 | 0.6392 | No | ||
| 31 | PLA2G4A | 6380364 | 5033 | 0.012 | 0.6223 | No | ||
| 32 | DPP10 | 4730746 | 5884 | 0.007 | 0.5771 | No | ||
| 33 | GPR126 | 6650204 | 6339 | 0.005 | 0.5530 | No | ||
| 34 | NPEPPS | 2630731 | 6563 | 0.004 | 0.5414 | No | ||
| 35 | LZTS1 | 4150088 | 6967 | 0.003 | 0.5199 | No | ||
| 36 | TAF4 | 1450170 | 7159 | 0.002 | 0.5098 | No | ||
| 37 | SLC25A27 | 6200707 6940019 | 7520 | 0.001 | 0.4904 | No | ||
| 38 | PRICKLE2 | 780408 | 7607 | 0.001 | 0.4859 | No | ||
| 39 | ZIC1 | 670113 | 8576 | -0.002 | 0.4339 | No | ||
| 40 | DYNLL1 | 5570113 | 8846 | -0.003 | 0.4196 | No | ||
| 41 | CILP | 4590037 | 8913 | -0.003 | 0.4163 | No | ||
| 42 | EPHB3 | 6650341 | 9017 | -0.003 | 0.4110 | No | ||
| 43 | ACVR2A | 6110647 | 9461 | -0.004 | 0.3875 | No | ||
| 44 | ABCC5 | 2100600 5050692 | 9721 | -0.005 | 0.3740 | No | ||
| 45 | BCL2L2 | 2760692 6770739 | 9936 | -0.006 | 0.3630 | No | ||
| 46 | MEIS1 | 1400575 | 10380 | -0.008 | 0.3398 | No | ||
| 47 | PPM2C | 3360209 | 11219 | -0.011 | 0.2956 | No | ||
| 48 | FLRT3 | 70685 2760497 6040519 | 11275 | -0.011 | 0.2937 | No | ||
| 49 | CBX1 | 5080408 1980239 | 11670 | -0.013 | 0.2736 | No | ||
| 50 | NXPH1 | 3870546 | 12507 | -0.020 | 0.2303 | No | ||
| 51 | EEF2 | 1050369 4670035 5890598 | 12561 | -0.020 | 0.2292 | No | ||
| 52 | GGA3 | 940082 2480167 | 13056 | -0.026 | 0.2049 | No | ||
| 53 | HOXC8 | 6220050 | 13139 | -0.027 | 0.2028 | No | ||
| 54 | CUGBP1 | 450292 510022 7050176 7050215 | 13251 | -0.028 | 0.1993 | No | ||
| 55 | SYNCRIP | 1690195 3140113 4670279 | 13266 | -0.028 | 0.2011 | No | ||
| 56 | MTMR4 | 4540524 | 13484 | -0.032 | 0.1922 | No | ||
| 57 | CTBP1 | 3780315 | 13591 | -0.033 | 0.1894 | No | ||
| 58 | ITPKA | 6220075 | 13923 | -0.040 | 0.1750 | No | ||
| 59 | PPM1G | 610725 | 13957 | -0.040 | 0.1768 | No | ||
| 60 | SH3GLB1 | 4590079 5670187 | 14287 | -0.047 | 0.1632 | No | ||
| 61 | PLXNB1 | 6220273 | 14380 | -0.050 | 0.1627 | No | ||
| 62 | LPHN1 | 1400113 3130301 | 14414 | -0.051 | 0.1654 | No | ||
| 63 | DCAMKL1 | 540095 2690092 | 14767 | -0.062 | 0.1520 | No | ||
| 64 | EIF4E | 1580403 70133 6380215 | 14939 | -0.069 | 0.1489 | No | ||
| 65 | AXIN2 | 3850131 | 15666 | -0.110 | 0.1195 | No | ||
| 66 | TLN1 | 6590411 | 16080 | -0.149 | 0.1104 | No | ||
| 67 | RBM14 | 5340731 5690315 | 17130 | -0.297 | 0.0801 | No |

