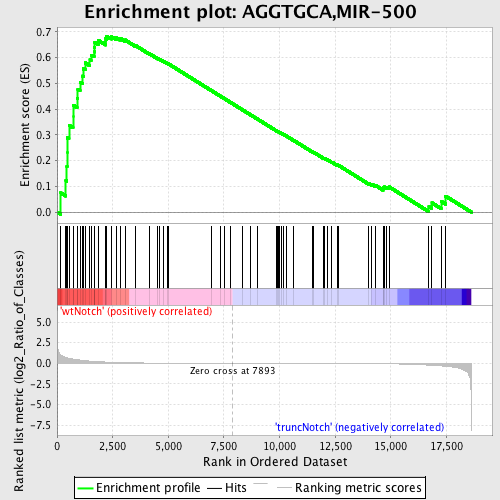
Profile of the Running ES Score & Positions of GeneSet Members on the Rank Ordered List
| Dataset | Set_03_truncNotch_versus_wtNotch.phenotype_truncNotch_versus_wtNotch.cls #wtNotch_versus_truncNotch.phenotype_truncNotch_versus_wtNotch.cls #wtNotch_versus_truncNotch_repos |
| Phenotype | phenotype_truncNotch_versus_wtNotch.cls#wtNotch_versus_truncNotch_repos |
| Upregulated in class | wtNotch |
| GeneSet | AGGTGCA,MIR-500 |
| Enrichment Score (ES) | 0.6829617 |
| Normalized Enrichment Score (NES) | 1.6619463 |
| Nominal p-value | 0.0 |
| FDR q-value | 0.028348861 |
| FWER p-Value | 0.204 |
| PROBE | DESCRIPTION (from dataset) | GENE SYMBOL | GENE_TITLE | RANK IN GENE LIST | RANK METRIC SCORE | RUNNING ES | CORE ENRICHMENT | |
|---|---|---|---|---|---|---|---|---|
| 1 | CUTL1 | 1570113 1770091 1850273 2100286 5340605 | 168 | 0.967 | 0.0746 | Yes | ||
| 2 | PPP2R5E | 70671 2120056 | 395 | 0.689 | 0.1221 | Yes | ||
| 3 | RAB14 | 6860139 | 440 | 0.658 | 0.1766 | Yes | ||
| 4 | OGT | 2360131 4610333 | 449 | 0.653 | 0.2327 | Yes | ||
| 5 | APRIN | 2810050 | 453 | 0.652 | 0.2890 | Yes | ||
| 6 | IVNS1ABP | 4760601 6520113 | 535 | 0.605 | 0.3369 | Yes | ||
| 7 | DCTN4 | 3390010 5550170 | 716 | 0.507 | 0.3711 | Yes | ||
| 8 | TIMM8A | 110279 | 718 | 0.506 | 0.4148 | Yes | ||
| 9 | PPP4R1 | 5670088 6420402 | 897 | 0.432 | 0.4426 | Yes | ||
| 10 | DDX3X | 2190020 | 934 | 0.421 | 0.4771 | Yes | ||
| 11 | UBE2D3 | 3190452 | 1032 | 0.381 | 0.5049 | Yes | ||
| 12 | NCOA1 | 3610438 | 1155 | 0.346 | 0.5283 | Yes | ||
| 13 | ABCC4 | 130309 | 1177 | 0.340 | 0.5566 | Yes | ||
| 14 | ING4 | 510632 2340619 2850176 5290706 | 1268 | 0.319 | 0.5793 | Yes | ||
| 15 | RBMS1 | 6400014 | 1477 | 0.261 | 0.5906 | Yes | ||
| 16 | SLC4A7 | 2370056 | 1528 | 0.250 | 0.6096 | Yes | ||
| 17 | KBTBD2 | 2320014 | 1663 | 0.223 | 0.6217 | Yes | ||
| 18 | PPP3CC | 2450139 | 1672 | 0.222 | 0.6404 | Yes | ||
| 19 | SEC24C | 6980707 | 1695 | 0.218 | 0.6581 | Yes | ||
| 20 | KLF9 | 3840022 | 1847 | 0.190 | 0.6665 | Yes | ||
| 21 | CAMK4 | 1690091 | 2183 | 0.141 | 0.6606 | Yes | ||
| 22 | NFAT5 | 2510411 5890195 6550152 | 2188 | 0.140 | 0.6725 | Yes | ||
| 23 | PURB | 5360138 | 2214 | 0.136 | 0.6830 | Yes | ||
| 24 | THAP11 | 6940025 | 2425 | 0.113 | 0.6814 | No | ||
| 25 | CIT | 2370601 | 2669 | 0.091 | 0.6762 | No | ||
| 26 | SOCS2 | 4760692 | 2829 | 0.080 | 0.6746 | No | ||
| 27 | CREB1 | 1500717 2230358 3610600 6550601 | 3052 | 0.065 | 0.6682 | No | ||
| 28 | NRF1 | 2650195 | 3507 | 0.042 | 0.6473 | No | ||
| 29 | KPNA3 | 7040088 | 4148 | 0.023 | 0.6149 | No | ||
| 30 | SORCS1 | 60411 5890373 | 4533 | 0.018 | 0.5957 | No | ||
| 31 | RTN4RL1 | 2630368 | 4608 | 0.017 | 0.5931 | No | ||
| 32 | E2F3 | 50162 460180 | 4775 | 0.015 | 0.5854 | No | ||
| 33 | HIPK1 | 110193 | 4952 | 0.013 | 0.5771 | No | ||
| 34 | DDX3Y | 1580278 4200519 | 4985 | 0.013 | 0.5765 | No | ||
| 35 | CACNB1 | 2940427 3710487 | 6940 | 0.003 | 0.4714 | No | ||
| 36 | HSPA14 | 4610487 | 7331 | 0.002 | 0.4505 | No | ||
| 37 | TBX2 | 1990563 | 7511 | 0.001 | 0.4409 | No | ||
| 38 | DRD1 | 430025 | 7811 | 0.000 | 0.4248 | No | ||
| 39 | SPG3A | 2760091 3120170 | 8335 | -0.001 | 0.3967 | No | ||
| 40 | ESRRG | 4010181 | 8681 | -0.002 | 0.3783 | No | ||
| 41 | SHPRH | 3990458 | 8999 | -0.003 | 0.3615 | No | ||
| 42 | BTBD11 | 6650154 | 9877 | -0.006 | 0.3147 | No | ||
| 43 | GABRB3 | 4150164 | 9894 | -0.006 | 0.3144 | No | ||
| 44 | PRKCE | 5700053 | 9945 | -0.006 | 0.3122 | No | ||
| 45 | FIGN | 7000601 | 10016 | -0.006 | 0.3089 | No | ||
| 46 | PHOX2B | 5270075 | 10089 | -0.006 | 0.3056 | No | ||
| 47 | GPM6A | 1660044 2750152 | 10186 | -0.007 | 0.3010 | No | ||
| 48 | LRRTM3 | 4210021 | 10295 | -0.007 | 0.2958 | No | ||
| 49 | HLF | 2370113 | 10610 | -0.008 | 0.2796 | No | ||
| 50 | RAI2 | 6770333 | 11459 | -0.012 | 0.2350 | No | ||
| 51 | TSSK2 | 5220324 | 11531 | -0.013 | 0.2323 | No | ||
| 52 | LBP | 6860019 | 11982 | -0.016 | 0.2093 | No | ||
| 53 | SYT8 | 4280551 | 12010 | -0.016 | 0.2092 | No | ||
| 54 | CHRD | 3140368 | 12137 | -0.017 | 0.2039 | No | ||
| 55 | OSBPL10 | 1980184 | 12348 | -0.018 | 0.1942 | No | ||
| 56 | CELSR3 | 5270731 7100082 | 12582 | -0.021 | 0.1834 | No | ||
| 57 | PLXDC2 | 6400358 | 12633 | -0.021 | 0.1825 | No | ||
| 58 | RAB21 | 5570070 | 14010 | -0.041 | 0.1119 | No | ||
| 59 | SP8 | 4060576 | 14152 | -0.045 | 0.1081 | No | ||
| 60 | RNF38 | 1940746 3140133 3840601 | 14311 | -0.048 | 0.1038 | No | ||
| 61 | MATR3 | 1940170 5340278 | 14650 | -0.059 | 0.0906 | No | ||
| 62 | MYNN | 1980022 4210358 | 14657 | -0.059 | 0.0954 | No | ||
| 63 | POFUT1 | 1570458 | 14707 | -0.060 | 0.0979 | No | ||
| 64 | RNF40 | 3610397 | 14825 | -0.065 | 0.0972 | No | ||
| 65 | FBXW7 | 4210338 7050280 | 14922 | -0.069 | 0.0980 | No | ||
| 66 | NOLA2 | 4060167 | 16713 | -0.230 | 0.0214 | No | ||
| 67 | HNRPA0 | 2680048 | 16849 | -0.251 | 0.0359 | No | ||
| 68 | SLC25A26 | 4210577 | 17263 | -0.324 | 0.0417 | No | ||
| 69 | EGLN2 | 540086 | 17461 | -0.361 | 0.0623 | No |

