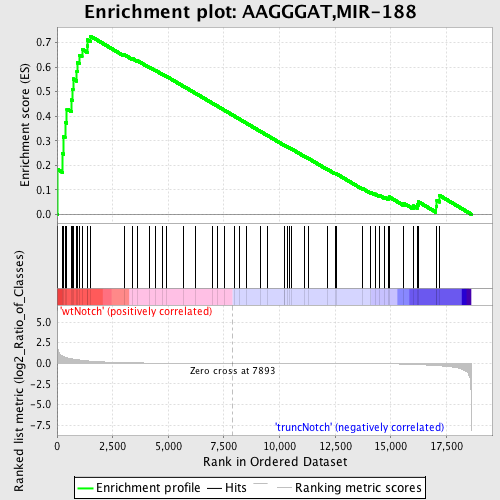
Profile of the Running ES Score & Positions of GeneSet Members on the Rank Ordered List
| Dataset | Set_03_truncNotch_versus_wtNotch.phenotype_truncNotch_versus_wtNotch.cls #wtNotch_versus_truncNotch.phenotype_truncNotch_versus_wtNotch.cls #wtNotch_versus_truncNotch_repos |
| Phenotype | phenotype_truncNotch_versus_wtNotch.cls#wtNotch_versus_truncNotch_repos |
| Upregulated in class | wtNotch |
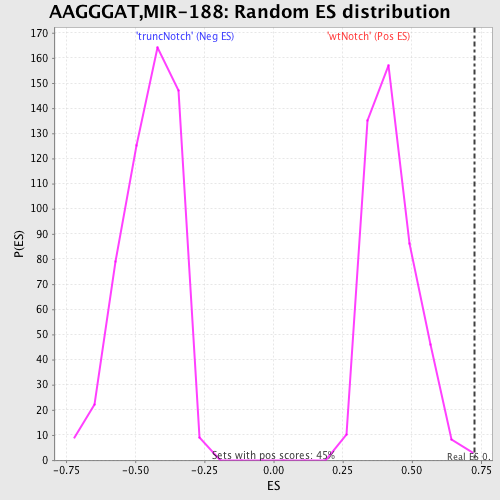
| GeneSet | AAGGGAT,MIR-188 |
| Enrichment Score (ES) | 0.72674865 |
| Normalized Enrichment Score (NES) | 1.7133636 |
| Nominal p-value | 0.002247191 |
| FDR q-value | 0.015382354 |
| FWER p-Value | 0.085 |
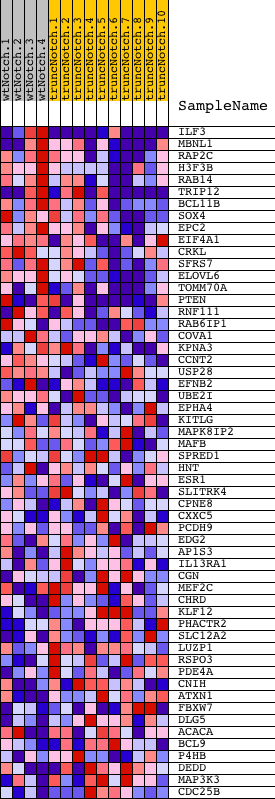
| PROBE | DESCRIPTION (from dataset) | GENE SYMBOL | GENE_TITLE | RANK IN GENE LIST | RANK METRIC SCORE | RUNNING ES | CORE ENRICHMENT | |
|---|---|---|---|---|---|---|---|---|
| 1 | ILF3 | 940722 3190647 6520110 | 17 | 2.087 | 0.1831 | Yes | ||
| 2 | MBNL1 | 2640762 7100048 | 235 | 0.865 | 0.2477 | Yes | ||
| 3 | RAP2C | 1690132 | 282 | 0.799 | 0.3157 | Yes | ||
| 4 | H3F3B | 1410300 | 359 | 0.727 | 0.3757 | Yes | ||
| 5 | RAB14 | 6860139 | 440 | 0.658 | 0.4294 | Yes | ||
| 6 | TRIP12 | 130154 5080288 5720446 | 639 | 0.542 | 0.4665 | Yes | ||
| 7 | BCL11B | 2680673 | 697 | 0.514 | 0.5087 | Yes | ||
| 8 | SOX4 | 2260091 | 720 | 0.506 | 0.5522 | Yes | ||
| 9 | EPC2 | 2470095 | 887 | 0.437 | 0.5818 | Yes | ||
| 10 | EIF4A1 | 1990341 2810300 | 907 | 0.427 | 0.6185 | Yes | ||
| 11 | CRKL | 4050427 | 994 | 0.398 | 0.6489 | Yes | ||
| 12 | SFRS7 | 2760408 | 1120 | 0.354 | 0.6734 | Yes | ||
| 13 | ELOVL6 | 5340746 | 1352 | 0.293 | 0.6867 | Yes | ||
| 14 | TOMM70A | 780114 | 1368 | 0.287 | 0.7113 | Yes | ||
| 15 | PTEN | 3390064 | 1501 | 0.256 | 0.7267 | Yes | ||
| 16 | RNF111 | 2970072 3140112 5130647 | 3006 | 0.067 | 0.6516 | No | ||
| 17 | RAB6IP1 | 4150044 | 3408 | 0.046 | 0.6341 | No | ||
| 18 | COVA1 | 5340504 5360594 | 3592 | 0.038 | 0.6276 | No | ||
| 19 | KPNA3 | 7040088 | 4148 | 0.023 | 0.5997 | No | ||
| 20 | CCNT2 | 2100390 4150563 | 4420 | 0.019 | 0.5868 | No | ||
| 21 | USP28 | 1450010 | 4722 | 0.015 | 0.5720 | No | ||
| 22 | EFNB2 | 5340136 | 4925 | 0.013 | 0.5622 | No | ||
| 23 | UBE2I | 2680056 6350446 | 5676 | 0.008 | 0.5225 | No | ||
| 24 | EPHA4 | 460750 | 6208 | 0.005 | 0.4944 | No | ||
| 25 | KITLG | 2120047 6220300 | 6995 | 0.003 | 0.4523 | No | ||
| 26 | MAPK8IP2 | 630373 | 7220 | 0.002 | 0.4404 | No | ||
| 27 | MAFB | 1230471 | 7513 | 0.001 | 0.4247 | No | ||
| 28 | SPRED1 | 6940706 | 7965 | -0.000 | 0.4005 | No | ||
| 29 | HNT | 6450731 | 8211 | -0.001 | 0.3873 | No | ||
| 30 | ESR1 | 4060372 5860193 | 8509 | -0.002 | 0.3715 | No | ||
| 31 | SLITRK4 | 5910022 | 9160 | -0.004 | 0.3368 | No | ||
| 32 | CPNE8 | 7040039 | 9458 | -0.004 | 0.3212 | No | ||
| 33 | CXXC5 | 840010 | 10198 | -0.007 | 0.2820 | No | ||
| 34 | PCDH9 | 2100136 | 10213 | -0.007 | 0.2818 | No | ||
| 35 | EDG2 | 6290215 | 10377 | -0.008 | 0.2737 | No | ||
| 36 | AP1S3 | 510594 1450242 2190576 | 10423 | -0.008 | 0.2720 | No | ||
| 37 | IL13RA1 | 5550609 | 10541 | -0.008 | 0.2664 | No | ||
| 38 | CGN | 5890139 6370167 6400537 | 11110 | -0.011 | 0.2367 | No | ||
| 39 | MEF2C | 670025 780338 | 11283 | -0.011 | 0.2285 | No | ||
| 40 | CHRD | 3140368 | 12137 | -0.017 | 0.1840 | No | ||
| 41 | KLF12 | 1660095 4810288 5340546 6520286 | 12491 | -0.020 | 0.1667 | No | ||
| 42 | PHACTR2 | 1580154 | 12548 | -0.020 | 0.1654 | No | ||
| 43 | SLC12A2 | 4610019 6040672 | 13719 | -0.036 | 0.1055 | No | ||
| 44 | LUZP1 | 940075 4280458 6180070 | 14085 | -0.043 | 0.0897 | No | ||
| 45 | RSPO3 | 7550703 6840435 | 14292 | -0.047 | 0.0828 | No | ||
| 46 | PDE4A | 1190619 1340129 5720100 6370035 | 14497 | -0.054 | 0.0765 | No | ||
| 47 | CNIH | 2190484 5080609 | 14715 | -0.060 | 0.0701 | No | ||
| 48 | ATXN1 | 5550156 | 14909 | -0.068 | 0.0657 | No | ||
| 49 | FBXW7 | 4210338 7050280 | 14922 | -0.069 | 0.0711 | No | ||
| 50 | DLG5 | 450215 | 15582 | -0.104 | 0.0448 | No | ||
| 51 | ACACA | 2490612 2680369 | 16012 | -0.142 | 0.0342 | No | ||
| 52 | BCL9 | 7100112 | 16185 | -0.161 | 0.0391 | No | ||
| 53 | P4HB | 6110056 | 16231 | -0.166 | 0.0513 | No | ||
| 54 | DEDD | 6400131 | 17030 | -0.280 | 0.0329 | No | ||
| 55 | MAP3K3 | 610685 | 17070 | -0.286 | 0.0561 | No | ||
| 56 | CDC25B | 6940102 | 17188 | -0.308 | 0.0769 | No |