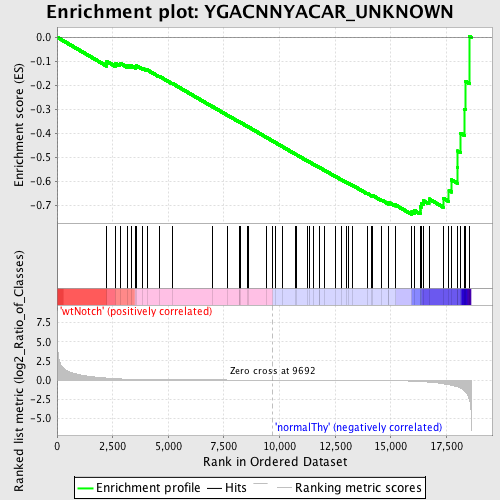
Profile of the Running ES Score & Positions of GeneSet Members on the Rank Ordered List
| Dataset | Set_03_wtNotch_versus_normalThy.phenotype_wtNotch_versus_normalThy.cls #wtNotch_versus_normalThy.phenotype_wtNotch_versus_normalThy.cls #wtNotch_versus_normalThy_repos |
| Phenotype | phenotype_wtNotch_versus_normalThy.cls#wtNotch_versus_normalThy_repos |
| Upregulated in class | normalThy |
| GeneSet | YGACNNYACAR_UNKNOWN |
| Enrichment Score (ES) | -0.7369325 |
| Normalized Enrichment Score (NES) | -1.632544 |
| Nominal p-value | 0.0 |
| FDR q-value | 0.11074747 |
| FWER p-Value | 0.184 |
| PROBE | DESCRIPTION (from dataset) | GENE SYMBOL | GENE_TITLE | RANK IN GENE LIST | RANK METRIC SCORE | RUNNING ES | CORE ENRICHMENT | |
|---|---|---|---|---|---|---|---|---|
| 1 | STAT6 | 1190010 5720019 | 2231 | 0.254 | -0.1007 | No | ||
| 2 | BNIP3L | 1940347 | 2638 | 0.174 | -0.1092 | No | ||
| 3 | TLE3 | 580040 4730121 | 2826 | 0.149 | -0.1079 | No | ||
| 4 | DUSP4 | 2690044 2850593 | 3175 | 0.113 | -0.1179 | No | ||
| 5 | PRM3 | 4810577 | 3324 | 0.099 | -0.1183 | No | ||
| 6 | PAPOLG | 2470400 | 3539 | 0.082 | -0.1235 | No | ||
| 7 | EGR3 | 6940128 | 3564 | 0.080 | -0.1186 | No | ||
| 8 | DUSP13 | 6400152 | 3847 | 0.062 | -0.1291 | No | ||
| 9 | TNFRSF21 | 6380100 | 4046 | 0.052 | -0.1358 | No | ||
| 10 | DUSP3 | 1240129 6840215 | 4598 | 0.035 | -0.1628 | No | ||
| 11 | NRXN1 | 460408 5340270 6370066 | 5179 | 0.025 | -0.1921 | No | ||
| 12 | UBE2H | 1980142 2970079 | 7004 | 0.010 | -0.2896 | No | ||
| 13 | RPL41 | 6940112 | 7654 | 0.007 | -0.3241 | No | ||
| 14 | GSC | 1580685 | 8187 | 0.005 | -0.3524 | No | ||
| 15 | GDPD2 | 7000040 | 8206 | 0.005 | -0.3530 | No | ||
| 16 | EPAS1 | 5290156 | 8247 | 0.005 | -0.3548 | No | ||
| 17 | CCR9 | 580068 | 8546 | 0.004 | -0.3705 | No | ||
| 18 | NEUROG1 | 380341 | 8583 | 0.004 | -0.3722 | No | ||
| 19 | ACTL7B | 460341 | 9394 | 0.001 | -0.4158 | No | ||
| 20 | ASB17 | 3520433 | 9689 | 0.000 | -0.4316 | No | ||
| 21 | RIN1 | 510593 | 9806 | -0.000 | -0.4378 | No | ||
| 22 | MYBPH | 2190711 | 10110 | -0.001 | -0.4541 | No | ||
| 23 | AGRP | 1990082 | 10716 | -0.003 | -0.4864 | No | ||
| 24 | P2RX3 | 4230397 | 10738 | -0.003 | -0.4873 | No | ||
| 25 | AQP7 | 2760576 2810072 2940722 | 11258 | -0.005 | -0.5149 | No | ||
| 26 | C3AR1 | 5720131 | 11328 | -0.005 | -0.5182 | No | ||
| 27 | KCNK7 | 4230576 | 11517 | -0.006 | -0.5279 | No | ||
| 28 | NEUROD2 | 5290097 | 11795 | -0.007 | -0.5423 | No | ||
| 29 | LGI3 | 5910301 | 11810 | -0.007 | -0.5425 | No | ||
| 30 | SMAD6 | 870504 | 12013 | -0.008 | -0.5528 | No | ||
| 31 | NEUROD6 | 4670731 | 12492 | -0.010 | -0.5778 | No | ||
| 32 | DMP1 | 4760398 | 12790 | -0.012 | -0.5928 | No | ||
| 33 | DNAJC5B | 60368 | 13021 | -0.014 | -0.6042 | No | ||
| 34 | RIMS2 | 670725 | 13108 | -0.014 | -0.6077 | No | ||
| 35 | NDST4 | 5080017 6590070 | 13258 | -0.016 | -0.6145 | No | ||
| 36 | SYT4 | 5080193 | 13935 | -0.024 | -0.6491 | No | ||
| 37 | PPM2C | 3360209 | 14148 | -0.028 | -0.6584 | No | ||
| 38 | BAG5 | 2230368 6420537 | 14189 | -0.029 | -0.6583 | No | ||
| 39 | HIF3A | 2630053 2680102 6450364 | 14586 | -0.038 | -0.6768 | No | ||
| 40 | OGDH | 3840333 6350100 | 14904 | -0.050 | -0.6900 | No | ||
| 41 | ZHX2 | 2900452 | 14917 | -0.051 | -0.6867 | No | ||
| 42 | SAMD8 | 540500 | 15197 | -0.067 | -0.6966 | No | ||
| 43 | ELOVL5 | 3800170 | 15946 | -0.140 | -0.7261 | Yes | ||
| 44 | MAPK3 | 580161 4780035 | 16052 | -0.154 | -0.7200 | Yes | ||
| 45 | NR6A1 | 4010347 | 16319 | -0.194 | -0.7194 | Yes | ||
| 46 | TBL1X | 6400524 | 16322 | -0.195 | -0.7046 | Yes | ||
| 47 | CREM | 840156 6380438 6660041 6660168 | 16364 | -0.204 | -0.6912 | Yes | ||
| 48 | PCBP1 | 1050088 | 16469 | -0.224 | -0.6796 | Yes | ||
| 49 | SLC4A2 | 2690114 | 16717 | -0.268 | -0.6723 | Yes | ||
| 50 | CDK5 | 940348 | 17354 | -0.483 | -0.6695 | Yes | ||
| 51 | USP3 | 2060332 | 17613 | -0.597 | -0.6375 | Yes | ||
| 52 | HOXA7 | 5910152 | 17729 | -0.661 | -0.5930 | Yes | ||
| 53 | TAZ | 7100193 | 17998 | -0.870 | -0.5406 | Yes | ||
| 54 | RAI1 | 110377 5340670 | 18012 | -0.891 | -0.4729 | Yes | ||
| 55 | DCI | 3780021 | 18144 | -1.052 | -0.3992 | Yes | ||
| 56 | RNF44 | 5910692 | 18317 | -1.410 | -0.3002 | Yes | ||
| 57 | PDPK1 | 6650168 | 18363 | -1.543 | -0.1841 | Yes | ||
| 58 | FGF13 | 630575 1570440 5360121 | 18534 | -2.575 | 0.0044 | Yes |

