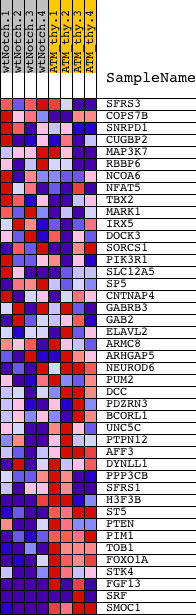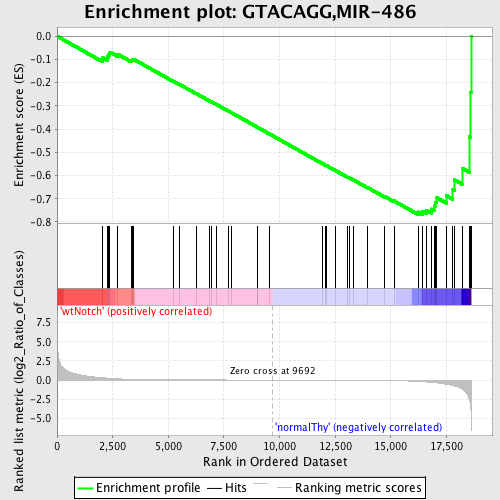
Profile of the Running ES Score & Positions of GeneSet Members on the Rank Ordered List
| Dataset | Set_03_wtNotch_versus_normalThy.phenotype_wtNotch_versus_normalThy.cls #wtNotch_versus_normalThy.phenotype_wtNotch_versus_normalThy.cls #wtNotch_versus_normalThy_repos |
| Phenotype | phenotype_wtNotch_versus_normalThy.cls#wtNotch_versus_normalThy_repos |
| Upregulated in class | normalThy |
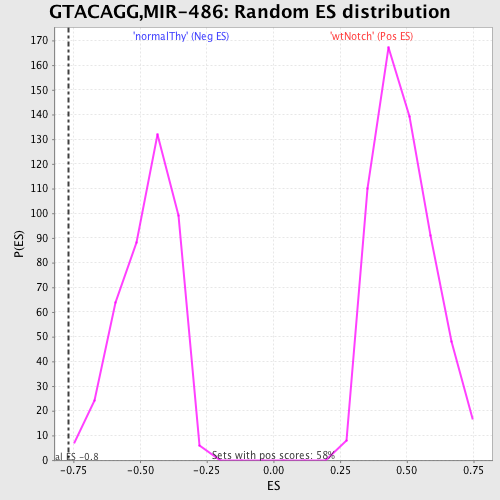
| GeneSet | GTACAGG,MIR-486 |
| Enrichment Score (ES) | -0.76767546 |
| Normalized Enrichment Score (NES) | -1.6262864 |
| Nominal p-value | 0.004761905 |
| FDR q-value | 0.09328995 |
| FWER p-Value | 0.206 |
| PROBE | DESCRIPTION (from dataset) | GENE SYMBOL | GENE_TITLE | RANK IN GENE LIST | RANK METRIC SCORE | RUNNING ES | CORE ENRICHMENT | |
|---|---|---|---|---|---|---|---|---|
| 1 | SFRS3 | 770315 4230593 | 2053 | 0.295 | -0.0930 | No | ||
| 2 | COPS7B | 2970484 4280022 | 2248 | 0.250 | -0.0886 | No | ||
| 3 | SNRPD1 | 4480162 | 2327 | 0.231 | -0.0791 | No | ||
| 4 | CUGBP2 | 6180121 6840139 | 2374 | 0.221 | -0.0685 | No | ||
| 5 | MAP3K7 | 6040068 | 2712 | 0.164 | -0.0769 | No | ||
| 6 | RBBP6 | 2320129 | 3332 | 0.098 | -0.1044 | No | ||
| 7 | NCOA6 | 1780333 6450110 | 3367 | 0.095 | -0.1006 | No | ||
| 8 | NFAT5 | 2510411 5890195 6550152 | 3440 | 0.090 | -0.0991 | No | ||
| 9 | TBX2 | 1990563 | 5224 | 0.024 | -0.1936 | No | ||
| 10 | MARK1 | 450484 | 5493 | 0.021 | -0.2068 | No | ||
| 11 | IRX5 | 2630494 | 6249 | 0.014 | -0.2466 | No | ||
| 12 | DOCK3 | 3290273 3360497 2850068 | 6851 | 0.010 | -0.2784 | No | ||
| 13 | SORCS1 | 60411 5890373 | 6942 | 0.010 | -0.2826 | No | ||
| 14 | PIK3R1 | 4730671 | 7181 | 0.009 | -0.2949 | No | ||
| 15 | SLC12A5 | 1980692 | 7708 | 0.007 | -0.3228 | No | ||
| 16 | SP5 | 3840309 | 7821 | 0.006 | -0.3285 | No | ||
| 17 | CNTNAP4 | 3830364 5340347 | 9015 | 0.002 | -0.3926 | No | ||
| 18 | GABRB3 | 4150164 | 9021 | 0.002 | -0.3927 | No | ||
| 19 | GAB2 | 1410280 2340520 4280040 | 9538 | 0.000 | -0.4205 | No | ||
| 20 | ELAVL2 | 360181 | 11935 | -0.008 | -0.5490 | No | ||
| 21 | ARMC8 | 520408 940132 4060368 4210102 | 12056 | -0.008 | -0.5550 | No | ||
| 22 | ARHGAP5 | 2510619 3360035 | 12127 | -0.008 | -0.5583 | No | ||
| 23 | NEUROD6 | 4670731 | 12492 | -0.010 | -0.5773 | No | ||
| 24 | PUM2 | 4200441 5910446 | 13068 | -0.014 | -0.6074 | No | ||
| 25 | DCC | 6450438 | 13121 | -0.015 | -0.6093 | No | ||
| 26 | PDZRN3 | 2340131 | 13338 | -0.016 | -0.6200 | No | ||
| 27 | BCORL1 | 1660008 | 13941 | -0.024 | -0.6509 | No | ||
| 28 | UNC5C | 2640056 | 14736 | -0.043 | -0.6911 | No | ||
| 29 | PTPN12 | 2030309 6020725 6130746 6290609 | 15145 | -0.063 | -0.7094 | No | ||
| 30 | AFF3 | 3870102 | 16229 | -0.181 | -0.7569 | Yes | ||
| 31 | DYNLL1 | 5570113 | 16427 | -0.216 | -0.7547 | Yes | ||
| 32 | PPP3CB | 6020156 | 16598 | -0.248 | -0.7492 | Yes | ||
| 33 | SFRS1 | 2360440 | 16829 | -0.295 | -0.7440 | Yes | ||
| 34 | H3F3B | 1410300 | 16946 | -0.323 | -0.7311 | Yes | ||
| 35 | ST5 | 3780204 | 17011 | -0.343 | -0.7142 | Yes | ||
| 36 | PTEN | 3390064 | 17072 | -0.362 | -0.6959 | Yes | ||
| 37 | PIM1 | 630047 | 17505 | -0.548 | -0.6866 | Yes | ||
| 38 | TOB1 | 4150138 | 17791 | -0.710 | -0.6598 | Yes | ||
| 39 | FOXO1A | 3120670 | 17857 | -0.757 | -0.6184 | Yes | ||
| 40 | STK4 | 2640152 | 18203 | -1.158 | -0.5683 | Yes | ||
| 41 | FGF13 | 630575 1570440 5360121 | 18534 | -2.575 | -0.4332 | Yes | ||
| 42 | SRF | 70139 2320039 | 18583 | -3.247 | -0.2431 | Yes | ||
| 43 | SMOC1 | 840039 | 18607 | -4.125 | 0.0005 | Yes |