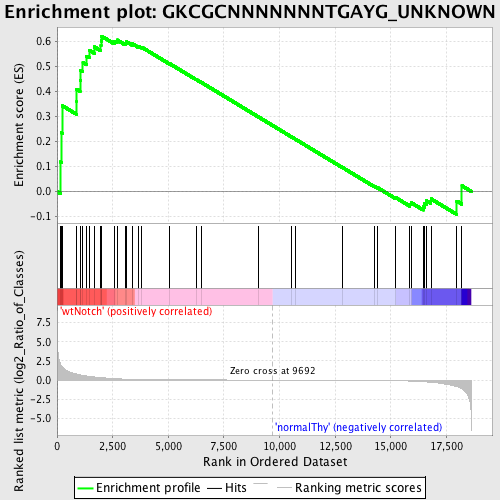
Profile of the Running ES Score & Positions of GeneSet Members on the Rank Ordered List
| Dataset | Set_03_wtNotch_versus_normalThy.phenotype_wtNotch_versus_normalThy.cls #wtNotch_versus_normalThy.phenotype_wtNotch_versus_normalThy.cls #wtNotch_versus_normalThy_repos |
| Phenotype | phenotype_wtNotch_versus_normalThy.cls#wtNotch_versus_normalThy_repos |
| Upregulated in class | wtNotch |
| GeneSet | GKCGCNNNNNNNTGAYG_UNKNOWN |
| Enrichment Score (ES) | 0.6206563 |
| Normalized Enrichment Score (NES) | 1.2499373 |
| Nominal p-value | 0.16187051 |
| FDR q-value | 1.0 |
| FWER p-Value | 1.0 |
| PROBE | DESCRIPTION (from dataset) | GENE SYMBOL | GENE_TITLE | RANK IN GENE LIST | RANK METRIC SCORE | RUNNING ES | CORE ENRICHMENT | |
|---|---|---|---|---|---|---|---|---|
| 1 | MRPL49 | 460541 610162 5340156 | 163 | 1.986 | 0.1180 | Yes | ||
| 2 | CNOT7 | 2450338 5720397 | 193 | 1.856 | 0.2348 | Yes | ||
| 3 | NUP133 | 2360168 4760017 | 245 | 1.721 | 0.3419 | Yes | ||
| 4 | PHF7 | 1510519 | 875 | 0.795 | 0.3588 | Yes | ||
| 5 | RFC1 | 1190673 | 882 | 0.785 | 0.4086 | Yes | ||
| 6 | PINX1 | 3360154 | 1033 | 0.665 | 0.4429 | Yes | ||
| 7 | PHF5A | 2690519 | 1061 | 0.649 | 0.4829 | Yes | ||
| 8 | COQ7 | 3190632 | 1162 | 0.596 | 0.5156 | Yes | ||
| 9 | PSME3 | 2810537 | 1319 | 0.530 | 0.5410 | Yes | ||
| 10 | BAP1 | 3830131 | 1465 | 0.472 | 0.5634 | Yes | ||
| 11 | NUP155 | 5720576 6220114 | 1671 | 0.399 | 0.5778 | Yes | ||
| 12 | NEK1 | 4570059 | 1969 | 0.317 | 0.5820 | Yes | ||
| 13 | NUPL2 | 6550537 | 1976 | 0.315 | 0.6018 | Yes | ||
| 14 | ACO2 | 4230600 | 1995 | 0.311 | 0.6207 | Yes | ||
| 15 | BRMS1 | 6860280 | 2580 | 0.183 | 0.6009 | No | ||
| 16 | RCE1 | 1980372 | 2696 | 0.166 | 0.6053 | No | ||
| 17 | RNF7 | 2030242 | 3070 | 0.124 | 0.5931 | No | ||
| 18 | GPAM | 1740180 | 3106 | 0.120 | 0.5989 | No | ||
| 19 | RNF141 | 130463 6840041 | 3378 | 0.094 | 0.5903 | No | ||
| 20 | QTRTD1 | 7000053 | 3662 | 0.073 | 0.5798 | No | ||
| 21 | RANBP2 | 4280338 | 3789 | 0.065 | 0.5771 | No | ||
| 22 | UBE4A | 6100520 | 5060 | 0.027 | 0.5105 | No | ||
| 23 | ANAPC10 | 870086 1170037 2260129 | 6253 | 0.014 | 0.4472 | No | ||
| 24 | MFN2 | 2260195 6100164 | 6501 | 0.012 | 0.4347 | No | ||
| 25 | NUP153 | 7000452 | 9036 | 0.002 | 0.2984 | No | ||
| 26 | NFX1 | 450504 | 10516 | -0.002 | 0.2190 | No | ||
| 27 | RNPS1 | 610736 1090021 | 10730 | -0.003 | 0.2077 | No | ||
| 28 | ABCE1 | 4280050 | 12848 | -0.012 | 0.0946 | No | ||
| 29 | UXT | 110019 5080066 | 14276 | -0.031 | 0.0197 | No | ||
| 30 | LCMT1 | 2230551 3830497 | 14402 | -0.033 | 0.0151 | No | ||
| 31 | BCL2L2 | 2760692 6770739 | 15194 | -0.066 | -0.0233 | No | ||
| 32 | DHRS1 | 5220673 | 15860 | -0.129 | -0.0509 | No | ||
| 33 | FAU | 7100465 | 15915 | -0.136 | -0.0451 | No | ||
| 34 | GTF3C2 | 670494 | 16458 | -0.221 | -0.0602 | No | ||
| 35 | DNAJB11 | 4150168 | 16522 | -0.232 | -0.0487 | No | ||
| 36 | ORMDL3 | 1340711 | 16606 | -0.249 | -0.0373 | No | ||
| 37 | SENP2 | 4540452 | 16805 | -0.287 | -0.0297 | No | ||
| 38 | ALS2CR2 | 6450128 7100092 | 17966 | -0.838 | -0.0386 | No | ||
| 39 | PSMB2 | 940035 4210324 | 18198 | -1.153 | 0.0225 | No |

