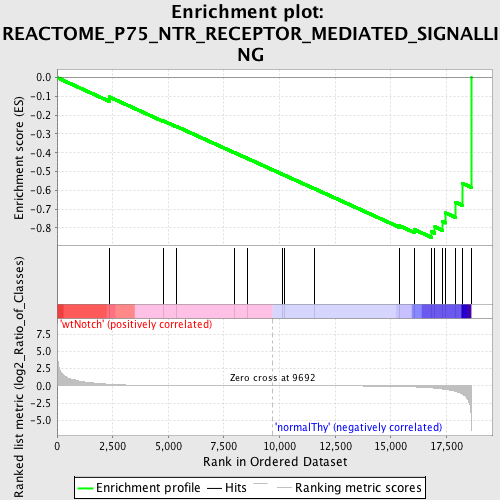
Profile of the Running ES Score & Positions of GeneSet Members on the Rank Ordered List
| Dataset | Set_03_wtNotch_versus_normalThy.phenotype_wtNotch_versus_normalThy.cls #wtNotch_versus_normalThy.phenotype_wtNotch_versus_normalThy.cls #wtNotch_versus_normalThy_repos |
| Phenotype | phenotype_wtNotch_versus_normalThy.cls#wtNotch_versus_normalThy_repos |
| Upregulated in class | normalThy |
| GeneSet | REACTOME_P75_NTR_RECEPTOR_MEDIATED_SIGNALLING |
| Enrichment Score (ES) | -0.85056984 |
| Normalized Enrichment Score (NES) | -1.5292683 |
| Nominal p-value | 0.017699115 |
| FDR q-value | 0.23993784 |
| FWER p-Value | 0.961 |
| PROBE | DESCRIPTION (from dataset) | GENE SYMBOL | GENE_TITLE | RANK IN GENE LIST | RANK METRIC SCORE | RUNNING ES | CORE ENRICHMENT | |
|---|---|---|---|---|---|---|---|---|
| 1 | NFKB1 | 5420358 | 2339 | 0.229 | -0.1027 | No | ||
| 2 | SORCS3 | 5700309 | 4768 | 0.032 | -0.2300 | No | ||
| 3 | RIPK2 | 5050072 6290632 | 5362 | 0.023 | -0.2596 | No | ||
| 4 | OMG | 6760066 | 7972 | 0.006 | -0.3993 | No | ||
| 5 | SMPD2 | 2370133 | 8564 | 0.004 | -0.4307 | No | ||
| 6 | YWHAE | 5310435 | 10135 | -0.001 | -0.5150 | No | ||
| 7 | NGFR | 3140102 | 10204 | -0.002 | -0.5185 | No | ||
| 8 | PRKCI | 5420139 | 11553 | -0.006 | -0.5904 | No | ||
| 9 | IKBKB | 6840072 | 15396 | -0.080 | -0.7889 | No | ||
| 10 | MAPK8 | 2640195 | 16060 | -0.156 | -0.8088 | No | ||
| 11 | ARHGDIA | 5900239 | 16838 | -0.298 | -0.8205 | Yes | ||
| 12 | RELA | 3830075 | 16981 | -0.335 | -0.7944 | Yes | ||
| 13 | ADAM17 | 360292 | 17318 | -0.463 | -0.7657 | Yes | ||
| 14 | SQSTM1 | 6550056 | 17467 | -0.530 | -0.7202 | Yes | ||
| 15 | NFKBIA | 1570152 | 17914 | -0.797 | -0.6637 | Yes | ||
| 16 | NGFRAP1 | 6770195 | 18207 | -1.166 | -0.5617 | Yes | ||
| 17 | RHOA | 580142 5900131 5340450 | 18614 | -5.784 | 0.0001 | Yes |

