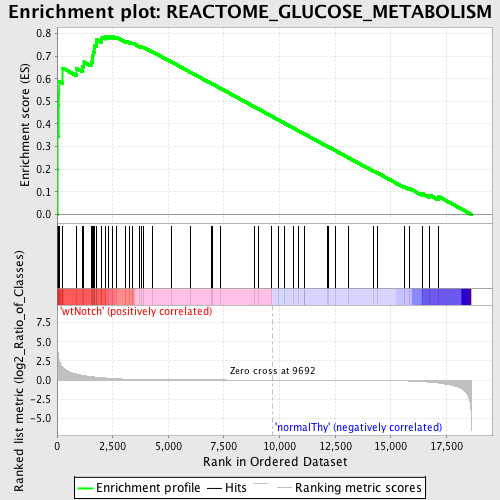
Profile of the Running ES Score & Positions of GeneSet Members on the Rank Ordered List
| Dataset | Set_03_wtNotch_versus_normalThy.phenotype_wtNotch_versus_normalThy.cls #wtNotch_versus_normalThy.phenotype_wtNotch_versus_normalThy.cls #wtNotch_versus_normalThy_repos |
| Phenotype | phenotype_wtNotch_versus_normalThy.cls#wtNotch_versus_normalThy_repos |
| Upregulated in class | wtNotch |
| GeneSet | REACTOME_GLUCOSE_METABOLISM |
| Enrichment Score (ES) | 0.7885556 |
| Normalized Enrichment Score (NES) | 1.6751105 |
| Nominal p-value | 0.0018083183 |
| FDR q-value | 0.030425236 |
| FWER p-Value | 0.063 |
| PROBE | DESCRIPTION (from dataset) | GENE SYMBOL | GENE_TITLE | RANK IN GENE LIST | RANK METRIC SCORE | RUNNING ES | CORE ENRICHMENT | |
|---|---|---|---|---|---|---|---|---|
| 1 | PGK1 | 1570494 630300 | 8 | 5.004 | 0.1977 | Yes | ||
| 2 | PKM2 | 6520403 70500 | 34 | 3.793 | 0.3466 | Yes | ||
| 3 | TPI1 | 1500215 2100154 | 44 | 3.470 | 0.4835 | Yes | ||
| 4 | BSG | 2900193 6520053 | 84 | 2.709 | 0.5887 | Yes | ||
| 5 | SLC25A11 | 130097 770685 | 253 | 1.702 | 0.6470 | Yes | ||
| 6 | NUP93 | 2190273 | 876 | 0.795 | 0.6450 | Yes | ||
| 7 | MDH2 | 1850601 | 1135 | 0.607 | 0.6551 | Yes | ||
| 8 | SLC25A1 | 4050402 | 1207 | 0.576 | 0.6741 | Yes | ||
| 9 | NUP160 | 1990551 | 1529 | 0.444 | 0.6744 | Yes | ||
| 10 | NUP43 | 3360482 | 1589 | 0.430 | 0.6883 | Yes | ||
| 11 | GOT2 | 4570164 5220450 | 1609 | 0.424 | 0.7040 | Yes | ||
| 12 | GOT1 | 2940465 | 1616 | 0.421 | 0.7204 | Yes | ||
| 13 | NUP155 | 5720576 6220114 | 1671 | 0.399 | 0.7333 | Yes | ||
| 14 | PDHA1 | 5550397 | 1693 | 0.392 | 0.7477 | Yes | ||
| 15 | GYG1 | 460746 1450138 | 1772 | 0.371 | 0.7581 | Yes | ||
| 16 | RAE1 | 7050121 | 1786 | 0.368 | 0.7720 | Yes | ||
| 17 | NUPL2 | 6550537 | 1976 | 0.315 | 0.7743 | Yes | ||
| 18 | SLC2A3 | 1990377 | 2016 | 0.304 | 0.7842 | Yes | ||
| 19 | PHKA2 | 610035 1090044 | 2174 | 0.267 | 0.7864 | Yes | ||
| 20 | PFKFB2 | 3940538 7100059 | 2307 | 0.235 | 0.7886 | Yes | ||
| 21 | DLAT | 430452 | 2471 | 0.202 | 0.7878 | No | ||
| 22 | DLD | 4150403 6590341 | 2678 | 0.169 | 0.7834 | No | ||
| 23 | NUP107 | 6380021 | 3088 | 0.122 | 0.7662 | No | ||
| 24 | PYGL | 7160520 | 3251 | 0.106 | 0.7617 | No | ||
| 25 | PHKG2 | 2640148 | 3391 | 0.093 | 0.7578 | No | ||
| 26 | NUP54 | 940546 2360156 4060278 | 3718 | 0.069 | 0.7430 | No | ||
| 27 | RANBP2 | 4280338 | 3789 | 0.065 | 0.7418 | No | ||
| 28 | SLC2A2 | 5130537 5720722 6770079 | 3873 | 0.061 | 0.7397 | No | ||
| 29 | NUP62 | 1240128 | 4272 | 0.044 | 0.7200 | No | ||
| 30 | MDH1 | 6660358 6760731 | 5146 | 0.025 | 0.6740 | No | ||
| 31 | PDHX | 870315 | 5988 | 0.016 | 0.6293 | No | ||
| 32 | FBP2 | 1580193 | 6917 | 0.010 | 0.5798 | No | ||
| 33 | PCK1 | 7000358 | 6994 | 0.010 | 0.5761 | No | ||
| 34 | PGM1 | 3840408 | 7359 | 0.008 | 0.5568 | No | ||
| 35 | CALM1 | 380128 | 8853 | 0.003 | 0.4764 | No | ||
| 36 | NUP153 | 7000452 | 9036 | 0.002 | 0.4667 | No | ||
| 37 | GCKR | 4070035 | 9619 | 0.000 | 0.4354 | No | ||
| 38 | SLC2A4 | 540441 | 9929 | -0.001 | 0.4188 | No | ||
| 39 | PYGM | 3940300 | 10203 | -0.002 | 0.4041 | No | ||
| 40 | GBE1 | 2190368 | 10638 | -0.003 | 0.3808 | No | ||
| 41 | GYS2 | 2570736 | 10861 | -0.004 | 0.3690 | No | ||
| 42 | GYS1 | 540154 | 11098 | -0.004 | 0.3565 | No | ||
| 43 | NUP35 | 5340408 | 11131 | -0.004 | 0.3549 | No | ||
| 44 | TPR | 1990066 6550390 | 12150 | -0.009 | 0.3004 | No | ||
| 45 | PFKFB1 | 2370128 | 12179 | -0.009 | 0.2993 | No | ||
| 46 | PHKG1 | 2570152 | 12523 | -0.010 | 0.2812 | No | ||
| 47 | HK1 | 4280402 | 13116 | -0.015 | 0.2499 | No | ||
| 48 | G6PC | 430093 | 14224 | -0.029 | 0.1914 | No | ||
| 49 | NUP188 | 1190470 | 14382 | -0.033 | 0.1843 | No | ||
| 50 | NUP37 | 2370097 6370435 6380008 | 15598 | -0.099 | 0.1228 | No | ||
| 51 | HK3 | 3190288 6510142 | 15822 | -0.124 | 0.1157 | No | ||
| 52 | PFKFB3 | 630706 | 16409 | -0.212 | 0.0925 | No | ||
| 53 | PDHB | 70215 610086 | 16745 | -0.273 | 0.0853 | No | ||
| 54 | SLC2A1 | 2100609 | 17145 | -0.391 | 0.0792 | No |

