Profile of the Running ES Score & Positions of GeneSet Members on the Rank Ordered List
| Dataset | Set_03_wtNotch_versus_normalThy.phenotype_wtNotch_versus_normalThy.cls #wtNotch_versus_normalThy.phenotype_wtNotch_versus_normalThy.cls #wtNotch_versus_normalThy_repos |
| Phenotype | phenotype_wtNotch_versus_normalThy.cls#wtNotch_versus_normalThy_repos |
| Upregulated in class | normalThy |
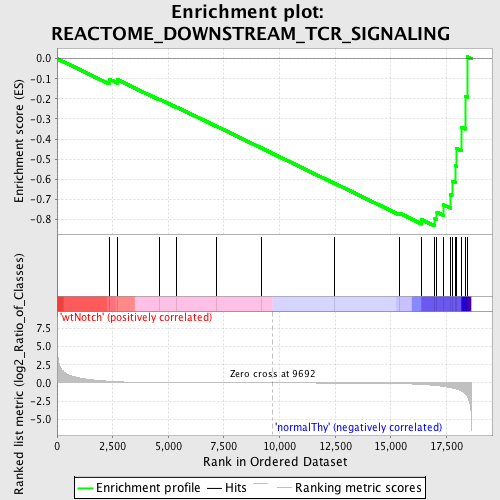
| GeneSet | REACTOME_DOWNSTREAM_TCR_SIGNALING |
| Enrichment Score (ES) | -0.8322206 |
| Normalized Enrichment Score (NES) | -1.4966443 |
| Nominal p-value | 0.021929825 |
| FDR q-value | 0.31932893 |
| FWER p-Value | 0.999 |
| PROBE | DESCRIPTION (from dataset) | GENE SYMBOL | GENE_TITLE | RANK IN GENE LIST | RANK METRIC SCORE | RUNNING ES | CORE ENRICHMENT | |
|---|---|---|---|---|---|---|---|---|
| 1 | NFKB1 | 5420358 | 2339 | 0.229 | -0.1015 | No | ||
| 2 | MAP3K7 | 6040068 | 2712 | 0.164 | -0.1042 | No | ||
| 3 | UBE2N | 520369 2900047 | 4590 | 0.036 | -0.2014 | No | ||
| 4 | RIPK2 | 5050072 6290632 | 5362 | 0.023 | -0.2404 | No | ||
| 5 | PIK3R1 | 4730671 | 7181 | 0.009 | -0.3372 | No | ||
| 6 | PRKCQ | 2260170 3870193 | 9203 | 0.001 | -0.4457 | No | ||
| 7 | CHUK | 7050736 | 12475 | -0.010 | -0.6205 | No | ||
| 8 | IKBKB | 6840072 | 15396 | -0.080 | -0.7691 | No | ||
| 9 | PIK3CB | 3800600 | 16391 | -0.208 | -0.8006 | Yes | ||
| 10 | RELA | 3830075 | 16981 | -0.335 | -0.7968 | Yes | ||
| 11 | PTEN | 3390064 | 17072 | -0.362 | -0.7632 | Yes | ||
| 12 | LCK | 3360142 | 17374 | -0.493 | -0.7272 | Yes | ||
| 13 | CD3D | 2810739 | 17668 | -0.628 | -0.6765 | Yes | ||
| 14 | BCL10 | 2360397 | 17750 | -0.680 | -0.6088 | Yes | ||
| 15 | NFKBIA | 1570152 | 17914 | -0.797 | -0.5331 | Yes | ||
| 16 | CD4 | 1090010 | 17959 | -0.836 | -0.4470 | Yes | ||
| 17 | CD3E | 3800056 | 18183 | -1.120 | -0.3404 | Yes | ||
| 18 | PDPK1 | 6650168 | 18363 | -1.543 | -0.1866 | Yes | ||
| 19 | CD3G | 2680288 | 18446 | -1.891 | 0.0091 | Yes |

