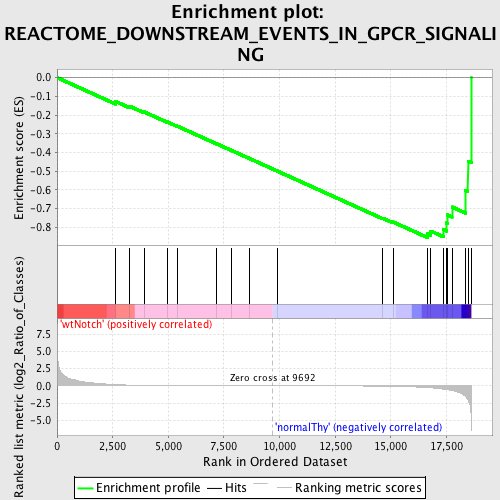
Profile of the Running ES Score & Positions of GeneSet Members on the Rank Ordered List
| Dataset | Set_03_wtNotch_versus_normalThy.phenotype_wtNotch_versus_normalThy.cls #wtNotch_versus_normalThy.phenotype_wtNotch_versus_normalThy.cls #wtNotch_versus_normalThy_repos |
| Phenotype | phenotype_wtNotch_versus_normalThy.cls#wtNotch_versus_normalThy_repos |
| Upregulated in class | normalThy |
| GeneSet | REACTOME_DOWNSTREAM_EVENTS_IN_GPCR_SIGNALING |
| Enrichment Score (ES) | -0.85380584 |
| Normalized Enrichment Score (NES) | -1.5644002 |
| Nominal p-value | 0.012631579 |
| FDR q-value | 0.1893873 |
| FWER p-Value | 0.813 |
| PROBE | DESCRIPTION (from dataset) | GENE SYMBOL | GENE_TITLE | RANK IN GENE LIST | RANK METRIC SCORE | RUNNING ES | CORE ENRICHMENT | |
|---|---|---|---|---|---|---|---|---|
| 1 | ROCK1 | 130044 | 2627 | 0.176 | -0.1274 | No | ||
| 2 | ADCY6 | 450364 6290670 6940286 | 3240 | 0.107 | -0.1518 | No | ||
| 3 | PDE4D | 2470528 6660014 | 3914 | 0.059 | -0.1834 | No | ||
| 4 | GRK5 | 1940348 4670053 | 4939 | 0.029 | -0.2362 | No | ||
| 5 | PLCB2 | 360132 | 5394 | 0.022 | -0.2588 | No | ||
| 6 | PIK3R1 | 4730671 | 7181 | 0.009 | -0.3542 | No | ||
| 7 | AKT1 | 5290746 | 7820 | 0.006 | -0.3880 | No | ||
| 8 | GNAZ | 6130296 | 8663 | 0.003 | -0.4330 | No | ||
| 9 | PIK3CA | 6220129 | 9883 | -0.001 | -0.4985 | No | ||
| 10 | GNAQ | 430670 4210131 5900736 | 14645 | -0.040 | -0.7514 | No | ||
| 11 | GNA12 | 1230301 | 15101 | -0.060 | -0.7712 | No | ||
| 12 | GNA13 | 4590102 | 16639 | -0.254 | -0.8338 | Yes | ||
| 13 | ADRBK1 | 1340333 | 16790 | -0.283 | -0.8196 | Yes | ||
| 14 | RHOG | 6760575 | 17364 | -0.489 | -0.8118 | Yes | ||
| 15 | GNG2 | 2230390 | 17510 | -0.549 | -0.7763 | Yes | ||
| 16 | PIK3CG | 5890110 | 17542 | -0.565 | -0.7335 | Yes | ||
| 17 | GNB1 | 2120397 | 17751 | -0.681 | -0.6910 | Yes | ||
| 18 | PDPK1 | 6650168 | 18363 | -1.543 | -0.6022 | Yes | ||
| 19 | GNAS | 630441 1850373 4050152 | 18468 | -2.029 | -0.4479 | Yes | ||
| 20 | RHOA | 580142 5900131 5340450 | 18614 | -5.784 | 0.0001 | Yes |

