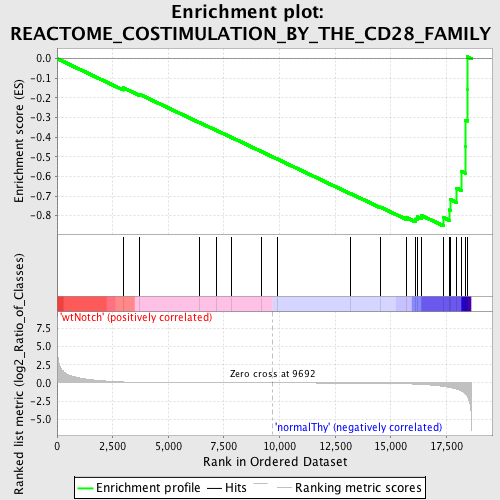
Profile of the Running ES Score & Positions of GeneSet Members on the Rank Ordered List
| Dataset | Set_03_wtNotch_versus_normalThy.phenotype_wtNotch_versus_normalThy.cls #wtNotch_versus_normalThy.phenotype_wtNotch_versus_normalThy.cls #wtNotch_versus_normalThy_repos |
| Phenotype | phenotype_wtNotch_versus_normalThy.cls#wtNotch_versus_normalThy_repos |
| Upregulated in class | normalThy |
| GeneSet | REACTOME_COSTIMULATION_BY_THE_CD28_FAMILY |
| Enrichment Score (ES) | -0.85232794 |
| Normalized Enrichment Score (NES) | -1.5849043 |
| Nominal p-value | 0.008810572 |
| FDR q-value | 0.1600569 |
| FWER p-Value | 0.675 |
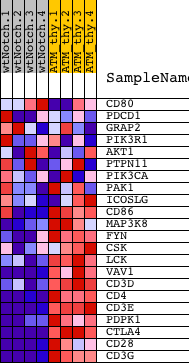
| PROBE | DESCRIPTION (from dataset) | GENE SYMBOL | GENE_TITLE | RANK IN GENE LIST | RANK METRIC SCORE | RUNNING ES | CORE ENRICHMENT | |
|---|---|---|---|---|---|---|---|---|
| 1 | CD80 | 870112 | 2970 | 0.133 | -0.1482 | No | ||
| 2 | PDCD1 | 4120082 | 3711 | 0.070 | -0.1819 | No | ||
| 3 | GRAP2 | 7100441 1410647 | 6397 | 0.013 | -0.3251 | No | ||
| 4 | PIK3R1 | 4730671 | 7181 | 0.009 | -0.3665 | No | ||
| 5 | AKT1 | 5290746 | 7820 | 0.006 | -0.4002 | No | ||
| 6 | PTPN11 | 2230100 2470180 6100528 | 9170 | 0.002 | -0.4727 | No | ||
| 7 | PIK3CA | 6220129 | 9883 | -0.001 | -0.5109 | No | ||
| 8 | PAK1 | 4540315 | 13205 | -0.015 | -0.6882 | No | ||
| 9 | ICOSLG | 70128 | 14519 | -0.036 | -0.7557 | No | ||
| 10 | CD86 | 3390471 6200280 | 15717 | -0.111 | -0.8104 | No | ||
| 11 | MAP3K8 | 2940286 | 16098 | -0.161 | -0.8168 | Yes | ||
| 12 | FYN | 2100468 4760520 4850687 | 16182 | -0.174 | -0.8061 | Yes | ||
| 13 | CSK | 6350593 | 16371 | -0.204 | -0.7984 | Yes | ||
| 14 | LCK | 3360142 | 17374 | -0.493 | -0.8095 | Yes | ||
| 15 | VAV1 | 6020487 | 17649 | -0.615 | -0.7707 | Yes | ||
| 16 | CD3D | 2810739 | 17668 | -0.628 | -0.7170 | Yes | ||
| 17 | CD4 | 1090010 | 17959 | -0.836 | -0.6598 | Yes | ||
| 18 | CD3E | 3800056 | 18183 | -1.120 | -0.5744 | Yes | ||
| 19 | PDPK1 | 6650168 | 18363 | -1.543 | -0.4497 | Yes | ||
| 20 | CTLA4 | 6590537 | 18369 | -1.563 | -0.3139 | Yes | ||
| 21 | CD28 | 1400739 4210093 | 18442 | -1.868 | -0.1553 | Yes | ||
| 22 | CD3G | 2680288 | 18446 | -1.891 | 0.0091 | Yes |