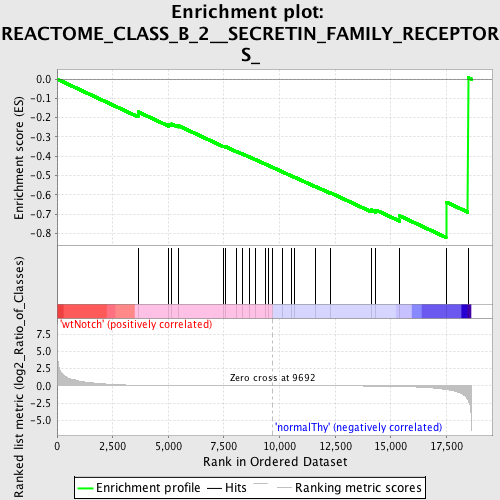
Profile of the Running ES Score & Positions of GeneSet Members on the Rank Ordered List
| Dataset | Set_03_wtNotch_versus_normalThy.phenotype_wtNotch_versus_normalThy.cls #wtNotch_versus_normalThy.phenotype_wtNotch_versus_normalThy.cls #wtNotch_versus_normalThy_repos |
| Phenotype | phenotype_wtNotch_versus_normalThy.cls#wtNotch_versus_normalThy_repos |
| Upregulated in class | normalThy |
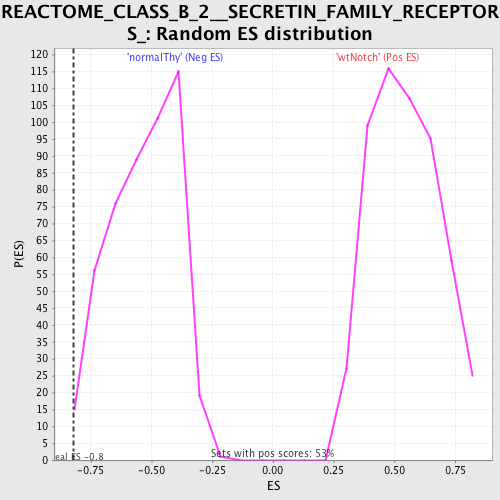
| GeneSet | REACTOME_CLASS_B_2__SECRETIN_FAMILY_RECEPTORS_ |
| Enrichment Score (ES) | -0.82150954 |
| Normalized Enrichment Score (NES) | -1.5430729 |
| Nominal p-value | 0.014830508 |
| FDR q-value | 0.21689372 |
| FWER p-Value | 0.913 |
| PROBE | DESCRIPTION (from dataset) | GENE SYMBOL | GENE_TITLE | RANK IN GENE LIST | RANK METRIC SCORE | RUNNING ES | CORE ENRICHMENT | |
|---|---|---|---|---|---|---|---|---|
| 1 | SCTR | 2940070 | 3641 | 0.075 | -0.1700 | No | ||
| 2 | ADCYAP1 | 520086 | 5025 | 0.027 | -0.2351 | No | ||
| 3 | GCG | 6220735 | 5145 | 0.025 | -0.2328 | No | ||
| 4 | IAPP | 4230040 | 5437 | 0.022 | -0.2409 | No | ||
| 5 | VIP | 2850647 | 7484 | 0.008 | -0.3483 | No | ||
| 6 | GLP2R | 4150577 5290273 7050095 | 7590 | 0.007 | -0.3515 | No | ||
| 7 | ADM2 | 4060102 | 8082 | 0.005 | -0.3761 | No | ||
| 8 | GLP1R | 6420528 | 8327 | 0.004 | -0.3877 | No | ||
| 9 | VIPR2 | 6520050 | 8636 | 0.003 | -0.4031 | No | ||
| 10 | GHRHR | 3130500 4010154 | 8915 | 0.002 | -0.4172 | No | ||
| 11 | GHRH | 4570575 | 9363 | 0.001 | -0.4409 | No | ||
| 12 | BAI3 | 940692 | 9500 | 0.001 | -0.4480 | No | ||
| 13 | GIP | 3170364 | 9670 | 0.000 | -0.4571 | No | ||
| 14 | ADCYAP1R1 | 3390020 4280184 5360180 | 10113 | -0.001 | -0.4804 | No | ||
| 15 | CRH | 3710301 | 10535 | -0.003 | -0.5022 | No | ||
| 16 | CALCA | 5860167 | 10672 | -0.003 | -0.5085 | No | ||
| 17 | GCGR | 6620497 | 11619 | -0.006 | -0.5572 | No | ||
| 18 | CALCR | 1690494 | 12280 | -0.009 | -0.5895 | No | ||
| 19 | CRHR2 | 4590672 | 14113 | -0.027 | -0.6787 | No | ||
| 20 | CALCRL | 4280035 | 14331 | -0.032 | -0.6794 | No | ||
| 21 | SCT | 2230348 | 15392 | -0.079 | -0.7092 | Yes | ||
| 22 | RAMP1 | 2320168 | 17482 | -0.534 | -0.6376 | Yes | ||
| 23 | GNAS | 630441 1850373 4050152 | 18468 | -2.029 | 0.0080 | Yes |