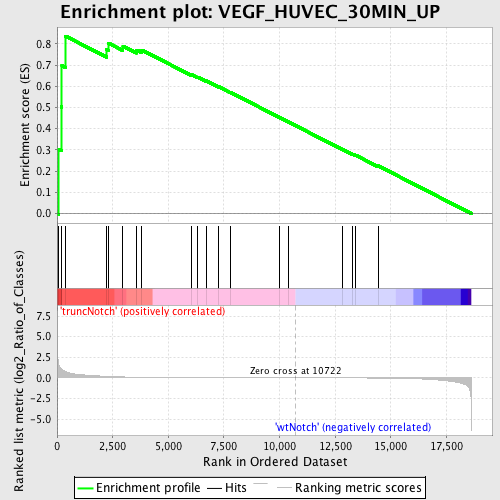
Profile of the Running ES Score & Positions of GeneSet Members on the Rank Ordered List
| Dataset | Set_03_truncNotch_versus_wtNotch.phenotype_truncNotch_versus_wtNotch.cls #truncNotch_versus_wtNotch |
| Phenotype | phenotype_truncNotch_versus_wtNotch.cls#truncNotch_versus_wtNotch |
| Upregulated in class | truncNotch |
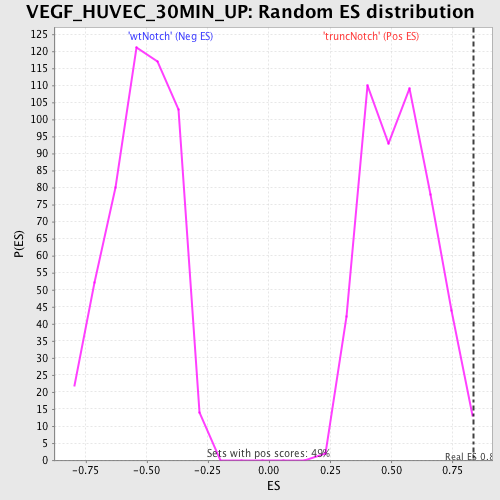
| GeneSet | VEGF_HUVEC_30MIN_UP |
| Enrichment Score (ES) | 0.83631015 |
| Normalized Enrichment Score (NES) | 1.5735284 |
| Nominal p-value | 0.00407332 |
| FDR q-value | 0.22586007 |
| FWER p-Value | 0.997 |
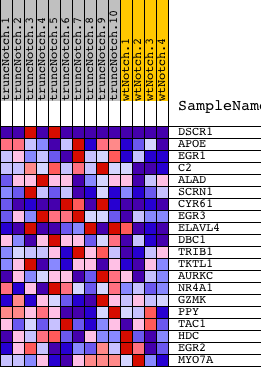
| PROBE | DESCRIPTION (from dataset) | GENE SYMBOL | GENE_TITLE | RANK IN GENE LIST | RANK METRIC SCORE | RUNNING ES | CORE ENRICHMENT | |
|---|---|---|---|---|---|---|---|---|
| 1 | DSCR1 | 4540048 6220039 | 81 | 1.573 | 0.3008 | Yes | ||
| 2 | APOE | 4200671 | 187 | 1.072 | 0.5031 | Yes | ||
| 3 | EGR1 | 4610347 | 214 | 1.010 | 0.6976 | Yes | ||
| 4 | C2 | 5390465 | 378 | 0.760 | 0.8363 | Yes | ||
| 5 | ALAD | 780576 | 2221 | 0.187 | 0.7735 | No | ||
| 6 | SCRN1 | 6040025 6580019 | 2302 | 0.177 | 0.8035 | No | ||
| 7 | CYR61 | 1240408 5290026 4120452 6550008 | 2959 | 0.109 | 0.7895 | No | ||
| 8 | EGR3 | 6940128 | 3572 | 0.073 | 0.7708 | No | ||
| 9 | ELAVL4 | 50735 3360086 5220167 | 3806 | 0.064 | 0.7708 | No | ||
| 10 | DBC1 | 4610156 | 6047 | 0.020 | 0.6543 | No | ||
| 11 | TRIB1 | 2320435 | 6327 | 0.018 | 0.6427 | No | ||
| 12 | TKTL1 | 2810672 6760102 | 6707 | 0.015 | 0.6253 | No | ||
| 13 | AURKC | 4060687 | 7253 | 0.012 | 0.5983 | No | ||
| 14 | NR4A1 | 6290161 | 7808 | 0.009 | 0.5703 | No | ||
| 15 | GZMK | 1410148 | 10003 | 0.002 | 0.4527 | No | ||
| 16 | PPY | 2340373 | 10388 | 0.001 | 0.4322 | No | ||
| 17 | TAC1 | 7000195 380706 | 12833 | -0.007 | 0.3022 | No | ||
| 18 | HDC | 4150463 | 13272 | -0.010 | 0.2807 | No | ||
| 19 | EGR2 | 3800403 | 13422 | -0.011 | 0.2748 | No | ||
| 20 | MYO7A | 2810102 | 14431 | -0.023 | 0.2250 | No |