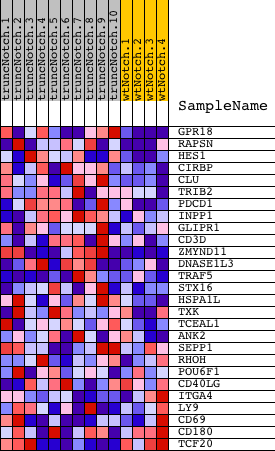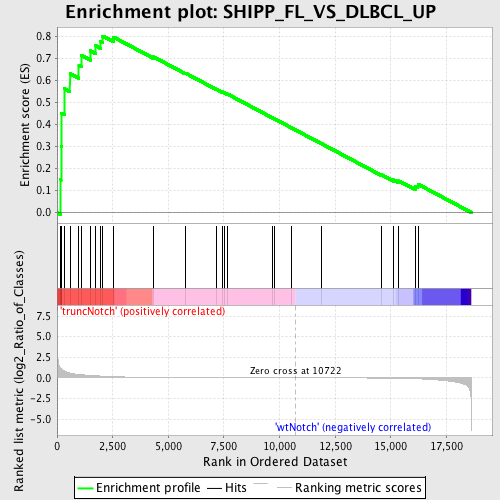
Profile of the Running ES Score & Positions of GeneSet Members on the Rank Ordered List
| Dataset | Set_03_truncNotch_versus_wtNotch.phenotype_truncNotch_versus_wtNotch.cls #truncNotch_versus_wtNotch |
| Phenotype | phenotype_truncNotch_versus_wtNotch.cls#truncNotch_versus_wtNotch |
| Upregulated in class | truncNotch |
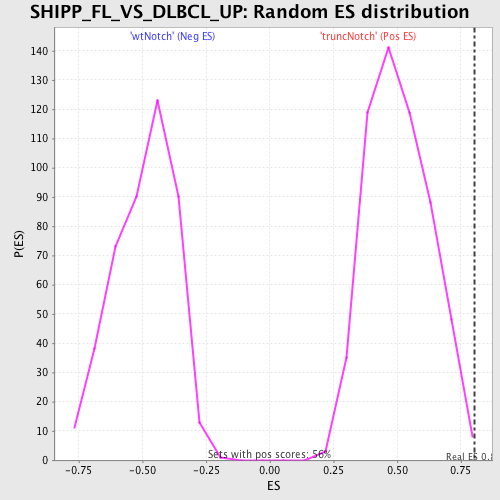
| GeneSet | SHIPP_FL_VS_DLBCL_UP |
| Enrichment Score (ES) | 0.8026465 |
| Normalized Enrichment Score (NES) | 1.5905781 |
| Nominal p-value | 0.0017825312 |
| FDR q-value | 0.20987642 |
| FWER p-Value | 0.98 |
| PROBE | DESCRIPTION (from dataset) | GENE SYMBOL | GENE_TITLE | RANK IN GENE LIST | RANK METRIC SCORE | RUNNING ES | CORE ENRICHMENT | |
|---|---|---|---|---|---|---|---|---|
| 1 | GPR18 | 2640551 | 165 | 1.110 | 0.1485 | Yes | ||
| 2 | RAPSN | 610110 2370162 | 176 | 1.091 | 0.3026 | Yes | ||
| 3 | HES1 | 4810280 | 196 | 1.054 | 0.4509 | Yes | ||
| 4 | CIRBP | 1850408 | 326 | 0.844 | 0.5636 | Yes | ||
| 5 | CLU | 5420075 | 579 | 0.576 | 0.6317 | Yes | ||
| 6 | TRIB2 | 4120605 | 982 | 0.408 | 0.6679 | Yes | ||
| 7 | PDCD1 | 4120082 | 1088 | 0.375 | 0.7154 | Yes | ||
| 8 | INPP1 | 670368 | 1497 | 0.295 | 0.7353 | Yes | ||
| 9 | GLIPR1 | 3360750 | 1740 | 0.255 | 0.7584 | Yes | ||
| 10 | CD3D | 2810739 | 1946 | 0.222 | 0.7788 | Yes | ||
| 11 | ZMYND11 | 630181 2570019 4850138 5360040 | 2055 | 0.209 | 0.8026 | Yes | ||
| 12 | DNASE1L3 | 670086 | 2529 | 0.150 | 0.7985 | No | ||
| 13 | TRAF5 | 3290064 | 4335 | 0.047 | 0.7081 | No | ||
| 14 | STX16 | 70315 | 5777 | 0.023 | 0.6338 | No | ||
| 15 | HSPA1L | 4010538 | 7148 | 0.012 | 0.5619 | No | ||
| 16 | TXK | 2320338 | 7415 | 0.011 | 0.5491 | No | ||
| 17 | TCEAL1 | 870577 | 7510 | 0.011 | 0.5456 | No | ||
| 18 | ANK2 | 6510546 | 7653 | 0.010 | 0.5393 | No | ||
| 19 | SEPP1 | 450273 | 9682 | 0.003 | 0.4307 | No | ||
| 20 | RHOH | 130184 | 9773 | 0.003 | 0.4262 | No | ||
| 21 | POU6F1 | 6200168 | 10519 | 0.001 | 0.3862 | No | ||
| 22 | CD40LG | 3120270 | 11892 | -0.003 | 0.3129 | No | ||
| 23 | ITGA4 | 2470739 | 14587 | -0.026 | 0.1716 | No | ||
| 24 | LY9 | 3360315 4070292 | 15137 | -0.043 | 0.1482 | No | ||
| 25 | CD69 | 380167 4730088 | 15360 | -0.052 | 0.1436 | No | ||
| 26 | CD180 | 360048 1410440 2850440 | 16106 | -0.105 | 0.1184 | No | ||
| 27 | TCF20 | 1190338 1240520 4070594 4810440 | 16222 | -0.117 | 0.1288 | No |