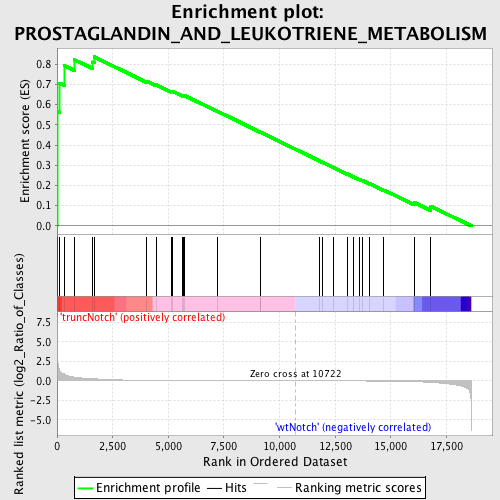
Profile of the Running ES Score & Positions of GeneSet Members on the Rank Ordered List
| Dataset | Set_03_truncNotch_versus_wtNotch.phenotype_truncNotch_versus_wtNotch.cls #truncNotch_versus_wtNotch |
| Phenotype | phenotype_truncNotch_versus_wtNotch.cls#truncNotch_versus_wtNotch |
| Upregulated in class | truncNotch |
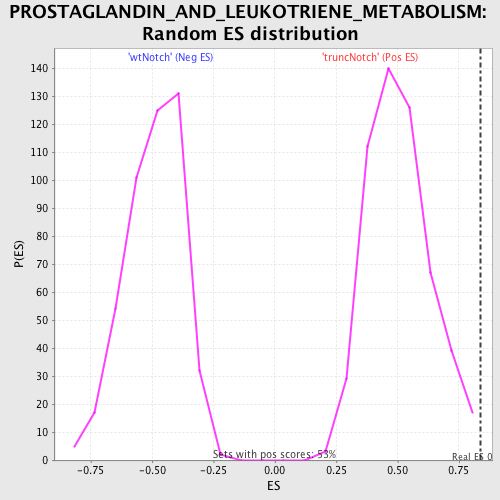
| GeneSet | PROSTAGLANDIN_AND_LEUKOTRIENE_METABOLISM |
| Enrichment Score (ES) | 0.83564234 |
| Normalized Enrichment Score (NES) | 1.6560844 |
| Nominal p-value | 0.0018761726 |
| FDR q-value | 0.23283494 |
| FWER p-Value | 0.639 |
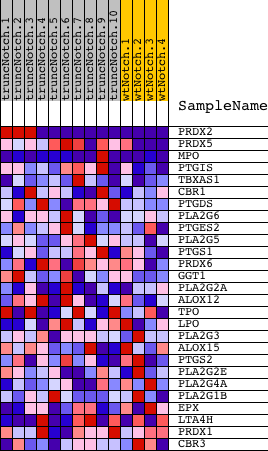
| PROBE | DESCRIPTION (from dataset) | GENE SYMBOL | GENE_TITLE | RANK IN GENE LIST | RANK METRIC SCORE | RUNNING ES | CORE ENRICHMENT | |
|---|---|---|---|---|---|---|---|---|
| 1 | PRDX2 | 6760095 4010619 5340577 | 2 | 4.972 | 0.5659 | Yes | ||
| 2 | PRDX5 | 1660592 2030091 | 120 | 1.290 | 0.7064 | Yes | ||
| 3 | MPO | 2360176 2760440 5690176 | 323 | 0.849 | 0.7922 | Yes | ||
| 4 | PTGIS | 6620411 | 793 | 0.471 | 0.8205 | Yes | ||
| 5 | TBXAS1 | 5050053 6900286 | 1579 | 0.281 | 0.8103 | Yes | ||
| 6 | CBR1 | 2120253 | 1670 | 0.266 | 0.8356 | Yes | ||
| 7 | PTGDS | 3610519 | 4025 | 0.057 | 0.7155 | No | ||
| 8 | PLA2G6 | 6040161 | 4467 | 0.045 | 0.6968 | No | ||
| 9 | PTGES2 | 4210097 | 5119 | 0.032 | 0.6654 | No | ||
| 10 | PLA2G5 | 6370605 | 5180 | 0.031 | 0.6657 | No | ||
| 11 | PTGS1 | 730193 1780273 6450195 | 5635 | 0.025 | 0.6441 | No | ||
| 12 | PRDX6 | 4920397 6380601 | 5682 | 0.024 | 0.6444 | No | ||
| 13 | GGT1 | 610082 | 5725 | 0.024 | 0.6449 | No | ||
| 14 | PLA2G2A | 3190458 | 7226 | 0.012 | 0.5655 | No | ||
| 15 | ALOX12 | 6290093 | 9125 | 0.005 | 0.4639 | No | ||
| 16 | TPO | 770609 | 9137 | 0.005 | 0.4639 | No | ||
| 17 | LPO | 730242 | 11776 | -0.003 | 0.3223 | No | ||
| 18 | PLA2G3 | 5130739 | 11926 | -0.004 | 0.3147 | No | ||
| 19 | ALOX15 | 6620333 | 12438 | -0.006 | 0.2879 | No | ||
| 20 | PTGS2 | 2510301 3170369 | 13030 | -0.009 | 0.2571 | No | ||
| 21 | PLA2G2E | 4060128 | 13306 | -0.010 | 0.2434 | No | ||
| 22 | PLA2G4A | 6380364 | 13583 | -0.012 | 0.2300 | No | ||
| 23 | PLA2G1B | 460500 | 13721 | -0.013 | 0.2241 | No | ||
| 24 | EPX | 940022 | 14041 | -0.017 | 0.2089 | No | ||
| 25 | LTA4H | 520020 5670673 | 14692 | -0.028 | 0.1772 | No | ||
| 26 | PRDX1 | 5720253 | 16058 | -0.101 | 0.1153 | No | ||
| 27 | CBR3 | 6590148 | 16796 | -0.196 | 0.0979 | No |