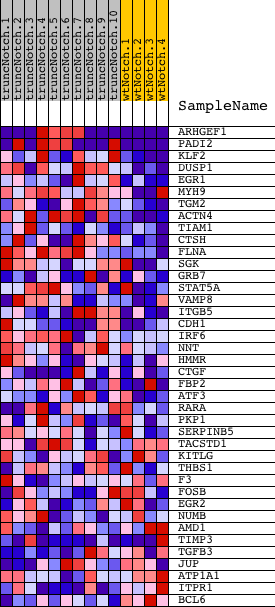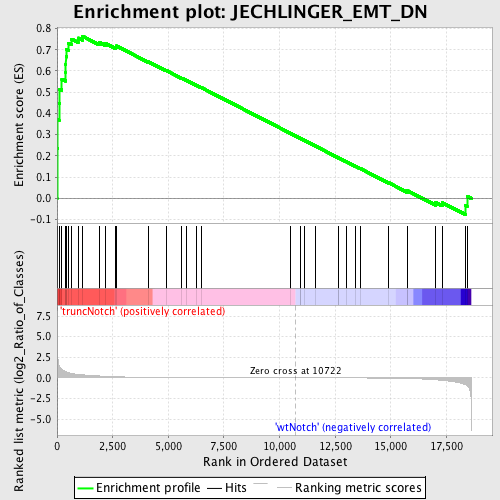
Profile of the Running ES Score & Positions of GeneSet Members on the Rank Ordered List
| Dataset | Set_03_truncNotch_versus_wtNotch.phenotype_truncNotch_versus_wtNotch.cls #truncNotch_versus_wtNotch |
| Phenotype | phenotype_truncNotch_versus_wtNotch.cls#truncNotch_versus_wtNotch |
| Upregulated in class | truncNotch |
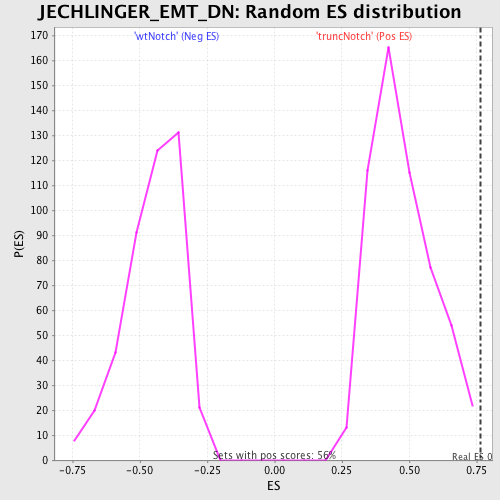
| GeneSet | JECHLINGER_EMT_DN |
| Enrichment Score (ES) | 0.7643197 |
| Normalized Enrichment Score (NES) | 1.6099733 |
| Nominal p-value | 0.0035587188 |
| FDR q-value | 0.23599209 |
| FWER p-Value | 0.918 |
| PROBE | DESCRIPTION (from dataset) | GENE SYMBOL | GENE_TITLE | RANK IN GENE LIST | RANK METRIC SCORE | RUNNING ES | CORE ENRICHMENT | |
|---|---|---|---|---|---|---|---|---|
| 1 | ARHGEF1 | 610347 4850603 6420672 | 4 | 4.545 | 0.2342 | Yes | ||
| 2 | PADI2 | 2940092 6420136 | 23 | 2.691 | 0.3720 | Yes | ||
| 3 | KLF2 | 6860270 | 91 | 1.525 | 0.4470 | Yes | ||
| 4 | DUSP1 | 6860121 | 115 | 1.337 | 0.5147 | Yes | ||
| 5 | EGR1 | 4610347 | 214 | 1.010 | 0.5615 | Yes | ||
| 6 | MYH9 | 3120091 4850292 | 382 | 0.754 | 0.5914 | Yes | ||
| 7 | TGM2 | 5360452 | 390 | 0.740 | 0.6292 | Yes | ||
| 8 | ACTN4 | 3840301 4590390 7050132 | 399 | 0.733 | 0.6665 | Yes | ||
| 9 | TIAM1 | 5420288 | 412 | 0.714 | 0.7027 | Yes | ||
| 10 | CTSH | 60524 | 508 | 0.625 | 0.7298 | Yes | ||
| 11 | FLNA | 5390193 | 637 | 0.535 | 0.7505 | Yes | ||
| 12 | SGK | 1400131 2480056 | 946 | 0.418 | 0.7555 | Yes | ||
| 13 | GRB7 | 2100471 | 1133 | 0.366 | 0.7643 | Yes | ||
| 14 | STAT5A | 2680458 | 1906 | 0.230 | 0.7346 | No | ||
| 15 | VAMP8 | 380411 1190139 | 2178 | 0.192 | 0.7299 | No | ||
| 16 | ITGB5 | 70129 | 2639 | 0.139 | 0.7123 | No | ||
| 17 | CDH1 | 1940736 | 2664 | 0.136 | 0.7180 | No | ||
| 18 | IRF6 | 840241 2640139 4050373 6840471 | 4089 | 0.055 | 0.6442 | No | ||
| 19 | NNT | 540253 1170471 5550092 6760397 | 4904 | 0.036 | 0.6022 | No | ||
| 20 | HMMR | 5720315 6380168 | 5601 | 0.025 | 0.5660 | No | ||
| 21 | CTGF | 4540577 | 5795 | 0.023 | 0.5568 | No | ||
| 22 | FBP2 | 1580193 | 6257 | 0.019 | 0.5329 | No | ||
| 23 | ATF3 | 1940546 | 6485 | 0.017 | 0.5216 | No | ||
| 24 | RARA | 4050161 | 10512 | 0.001 | 0.3049 | No | ||
| 25 | PKP1 | 1500433 | 10918 | -0.001 | 0.2831 | No | ||
| 26 | SERPINB5 | 6940050 | 10942 | -0.001 | 0.2819 | No | ||
| 27 | TACSTD1 | 3780025 | 11131 | -0.001 | 0.2719 | No | ||
| 28 | KITLG | 2120047 6220300 | 11621 | -0.003 | 0.2457 | No | ||
| 29 | THBS1 | 4560494 430288 | 12659 | -0.007 | 0.1902 | No | ||
| 30 | F3 | 2940180 | 12668 | -0.007 | 0.1901 | No | ||
| 31 | FOSB | 1940142 | 13004 | -0.008 | 0.1725 | No | ||
| 32 | EGR2 | 3800403 | 13422 | -0.011 | 0.1506 | No | ||
| 33 | NUMB | 2450735 3800253 6350040 | 13642 | -0.013 | 0.1395 | No | ||
| 34 | AMD1 | 6290128 | 14900 | -0.034 | 0.0736 | No | ||
| 35 | TIMP3 | 1450504 1980270 | 15744 | -0.077 | 0.0322 | No | ||
| 36 | TGFB3 | 1070041 | 15747 | -0.077 | 0.0360 | No | ||
| 37 | JUP | 2510671 | 17016 | -0.233 | -0.0202 | No | ||
| 38 | ATP1A1 | 5670451 | 17311 | -0.306 | -0.0202 | No | ||
| 39 | ITPR1 | 3450519 | 18349 | -0.823 | -0.0336 | No | ||
| 40 | BCL6 | 940100 | 18431 | -0.930 | 0.0100 | No |