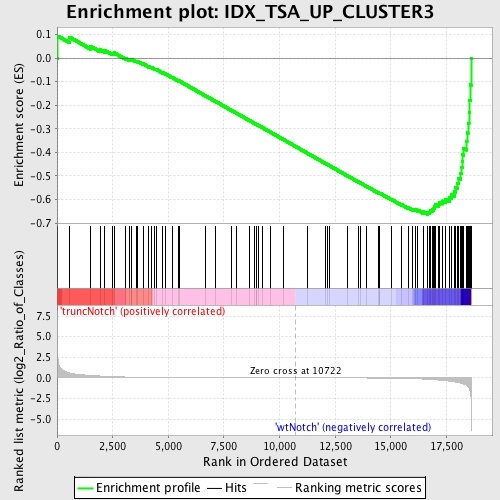
Profile of the Running ES Score & Positions of GeneSet Members on the Rank Ordered List
| Dataset | Set_03_truncNotch_versus_wtNotch.phenotype_truncNotch_versus_wtNotch.cls #truncNotch_versus_wtNotch |
| Phenotype | phenotype_truncNotch_versus_wtNotch.cls#truncNotch_versus_wtNotch |
| Upregulated in class | wtNotch |
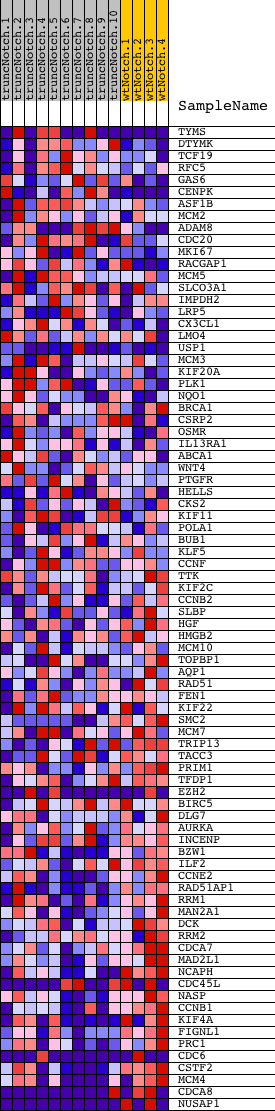
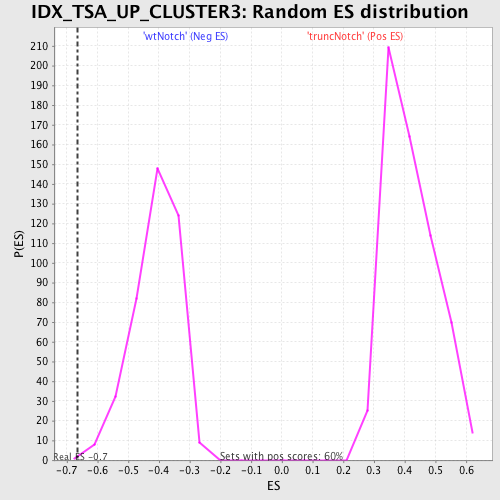
| GeneSet | IDX_TSA_UP_CLUSTER3 |
| Enrichment Score (ES) | -0.66366816 |
| Normalized Enrichment Score (NES) | -1.6196362 |
| Nominal p-value | 0.0024752475 |
| FDR q-value | 0.18114828 |
| FWER p-Value | 0.918 |
| PROBE | DESCRIPTION (from dataset) | GENE SYMBOL | GENE_TITLE | RANK IN GENE LIST | RANK METRIC SCORE | RUNNING ES | CORE ENRICHMENT | |
|---|---|---|---|---|---|---|---|---|
| 1 | TYMS | 940450 1940068 3710008 5570546 | 38 | 2.352 | 0.0936 | No | ||
| 2 | DTYMK | 2340377 | 563 | 0.586 | 0.0891 | No | ||
| 3 | TCF19 | 6200152 | 1504 | 0.293 | 0.0503 | No | ||
| 4 | RFC5 | 3800452 6020091 | 1934 | 0.225 | 0.0363 | No | ||
| 5 | GAS6 | 4480021 | 2138 | 0.197 | 0.0334 | No | ||
| 6 | CENPK | 1740722 6200068 | 2494 | 0.153 | 0.0205 | No | ||
| 7 | ASF1B | 6590706 | 2560 | 0.147 | 0.0229 | No | ||
| 8 | MCM2 | 5050139 | 3062 | 0.103 | 0.0001 | No | ||
| 9 | ADAM8 | 450347 5670609 | 3259 | 0.090 | -0.0068 | No | ||
| 10 | CDC20 | 3440017 3440044 6220088 | 3342 | 0.085 | -0.0078 | No | ||
| 11 | MKI67 | 3440750 4480072 7050288 | 3351 | 0.085 | -0.0048 | No | ||
| 12 | RACGAP1 | 3990162 6620736 | 3563 | 0.074 | -0.0132 | No | ||
| 13 | MCM5 | 2680647 | 3628 | 0.071 | -0.0138 | No | ||
| 14 | SLCO3A1 | 1050408 2370156 6110072 | 3872 | 0.061 | -0.0244 | No | ||
| 15 | IMPDH2 | 5220138 | 4129 | 0.053 | -0.0360 | No | ||
| 16 | LRP5 | 2100397 3170484 | 4233 | 0.050 | -0.0395 | No | ||
| 17 | CX3CL1 | 3990707 | 4394 | 0.046 | -0.0463 | No | ||
| 18 | LMO4 | 3800746 | 4468 | 0.045 | -0.0484 | No | ||
| 19 | USP1 | 2760541 5690438 6220673 | 4756 | 0.038 | -0.0623 | No | ||
| 20 | MCM3 | 5570068 | 4864 | 0.036 | -0.0666 | No | ||
| 21 | KIF20A | 2650050 | 5168 | 0.031 | -0.0817 | No | ||
| 22 | PLK1 | 1780369 2640121 | 5459 | 0.027 | -0.0963 | No | ||
| 23 | NQO1 | 3450136 6840121 | 5486 | 0.027 | -0.0966 | No | ||
| 24 | BRCA1 | 4780669 | 6679 | 0.015 | -0.1603 | No | ||
| 25 | CSRP2 | 1030575 | 7128 | 0.012 | -0.1840 | No | ||
| 26 | OSMR | 1990519 | 7848 | 0.009 | -0.2224 | No | ||
| 27 | IL13RA1 | 5550609 | 8075 | 0.008 | -0.2342 | No | ||
| 28 | ABCA1 | 6290156 | 8669 | 0.006 | -0.2660 | No | ||
| 29 | WNT4 | 4150619 | 8873 | 0.005 | -0.2767 | No | ||
| 30 | PTGFR | 3850373 | 8955 | 0.005 | -0.2809 | No | ||
| 31 | HELLS | 4560086 4810025 | 8978 | 0.005 | -0.2819 | No | ||
| 32 | CKS2 | 1410156 | 9073 | 0.005 | -0.2867 | No | ||
| 33 | KIF11 | 5390139 | 9250 | 0.004 | -0.2961 | No | ||
| 34 | POLA1 | 4760541 | 9613 | 0.003 | -0.3155 | No | ||
| 35 | BUB1 | 5390270 | 10161 | 0.002 | -0.3449 | No | ||
| 36 | KLF5 | 3840348 | 11247 | -0.001 | -0.4034 | No | ||
| 37 | CCNF | 6370288 | 12050 | -0.004 | -0.4465 | No | ||
| 38 | TTK | 3800129 | 12142 | -0.004 | -0.4512 | No | ||
| 39 | KIF2C | 6940082 | 12263 | -0.005 | -0.4575 | No | ||
| 40 | CCNB2 | 6510528 | 13033 | -0.009 | -0.4987 | No | ||
| 41 | SLBP | 6220601 | 13526 | -0.012 | -0.5247 | No | ||
| 42 | HGF | 3360593 | 13641 | -0.013 | -0.5303 | No | ||
| 43 | HMGB2 | 2640603 | 13918 | -0.016 | -0.5446 | No | ||
| 44 | MCM10 | 4920632 | 14437 | -0.023 | -0.5716 | No | ||
| 45 | TOPBP1 | 6020333 | 14491 | -0.024 | -0.5735 | No | ||
| 46 | AQP1 | 450338 6020292 | 14503 | -0.024 | -0.5731 | No | ||
| 47 | RAD51 | 6110450 6980280 | 15032 | -0.039 | -0.6000 | No | ||
| 48 | FEN1 | 1770541 | 15483 | -0.059 | -0.6219 | No | ||
| 49 | KIF22 | 1190368 | 15776 | -0.079 | -0.6344 | No | ||
| 50 | SMC2 | 4810133 | 15987 | -0.095 | -0.6419 | No | ||
| 51 | MCM7 | 3290292 5220056 | 16086 | -0.103 | -0.6430 | No | ||
| 52 | TRIP13 | 6860341 | 16202 | -0.115 | -0.6445 | No | ||
| 53 | TACC3 | 5130592 | 16459 | -0.144 | -0.6525 | No | ||
| 54 | PRIM1 | 6420746 | 16667 | -0.175 | -0.6565 | Yes | ||
| 55 | TFDP1 | 1980112 | 16756 | -0.187 | -0.6537 | Yes | ||
| 56 | EZH2 | 6130605 6380524 | 16764 | -0.189 | -0.6464 | Yes | ||
| 57 | BIRC5 | 110408 580014 1770632 | 16855 | -0.207 | -0.6428 | Yes | ||
| 58 | DLG7 | 3120041 | 16935 | -0.220 | -0.6381 | Yes | ||
| 59 | AURKA | 780537 | 16964 | -0.225 | -0.6305 | Yes | ||
| 60 | INCENP | 520593 | 16986 | -0.229 | -0.6223 | Yes | ||
| 61 | BZW1 | 460270 | 17158 | -0.265 | -0.6207 | Yes | ||
| 62 | ILF2 | 2900253 | 17184 | -0.270 | -0.6111 | Yes | ||
| 63 | CCNE2 | 3120537 | 17335 | -0.315 | -0.6064 | Yes | ||
| 64 | RAD51AP1 | 4050736 6370528 | 17471 | -0.349 | -0.5995 | Yes | ||
| 65 | RRM1 | 4150433 | 17644 | -0.408 | -0.5922 | Yes | ||
| 66 | MAN2A1 | 6650176 | 17734 | -0.438 | -0.5791 | Yes | ||
| 67 | DCK | 6900411 | 17856 | -0.485 | -0.5659 | Yes | ||
| 68 | RRM2 | 6350059 6940162 | 17909 | -0.510 | -0.5480 | Yes | ||
| 69 | CDCA7 | 3060097 | 18003 | -0.558 | -0.5304 | Yes | ||
| 70 | MAD2L1 | 4480725 | 18047 | -0.583 | -0.5090 | Yes | ||
| 71 | NCAPH | 6220435 | 18140 | -0.637 | -0.4880 | Yes | ||
| 72 | CDC45L | 70537 3130114 | 18193 | -0.667 | -0.4637 | Yes | ||
| 73 | NASP | 2260139 2940369 5130707 | 18205 | -0.676 | -0.4368 | Yes | ||
| 74 | CCNB1 | 4590433 4780372 | 18216 | -0.685 | -0.4095 | Yes | ||
| 75 | KIF4A | 1410465 4760070 | 18267 | -0.741 | -0.3821 | Yes | ||
| 76 | FIGNL1 | 6860390 | 18416 | -0.914 | -0.3529 | Yes | ||
| 77 | PRC1 | 870092 5890204 | 18426 | -0.927 | -0.3157 | Yes | ||
| 78 | CDC6 | 4570296 5360600 | 18471 | -1.030 | -0.2762 | Yes | ||
| 79 | CSTF2 | 6040463 | 18515 | -1.162 | -0.2313 | Yes | ||
| 80 | MCM4 | 2760673 5420711 | 18538 | -1.324 | -0.1787 | Yes | ||
| 81 | CDCA8 | 2340286 6980019 | 18575 | -1.667 | -0.1129 | Yes | ||
| 82 | NUSAP1 | 940048 3120435 | 18611 | -2.829 | 0.0003 | Yes |