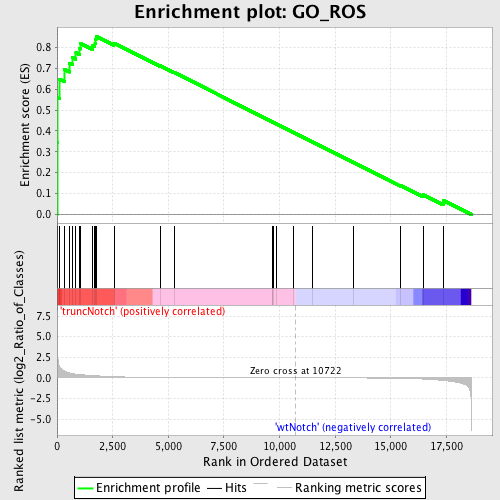
Profile of the Running ES Score & Positions of GeneSet Members on the Rank Ordered List
| Dataset | Set_03_truncNotch_versus_wtNotch.phenotype_truncNotch_versus_wtNotch.cls #truncNotch_versus_wtNotch |
| Phenotype | phenotype_truncNotch_versus_wtNotch.cls#truncNotch_versus_wtNotch |
| Upregulated in class | truncNotch |
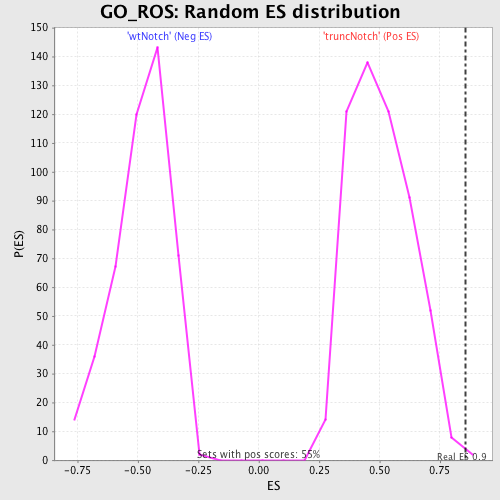
| GeneSet | GO_ROS |
| Enrichment Score (ES) | 0.8537852 |
| Normalized Enrichment Score (NES) | 1.6892321 |
| Nominal p-value | 0.0036563072 |
| FDR q-value | 0.14127336 |
| FWER p-Value | 0.368 |
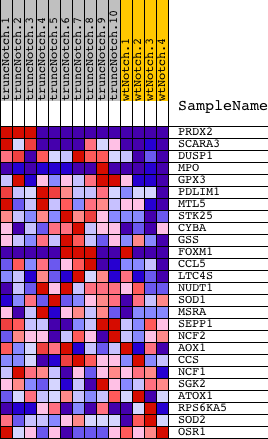
| PROBE | DESCRIPTION (from dataset) | GENE SYMBOL | GENE_TITLE | RANK IN GENE LIST | RANK METRIC SCORE | RUNNING ES | CORE ENRICHMENT | |
|---|---|---|---|---|---|---|---|---|
| 1 | PRDX2 | 6760095 4010619 5340577 | 2 | 4.972 | 0.3456 | Yes | ||
| 2 | SCARA3 | 5890487 | 16 | 3.084 | 0.5593 | Yes | ||
| 3 | DUSP1 | 6860121 | 115 | 1.337 | 0.6470 | Yes | ||
| 4 | MPO | 2360176 2760440 5690176 | 323 | 0.849 | 0.6949 | Yes | ||
| 5 | GPX3 | 1340450 | 566 | 0.585 | 0.7225 | Yes | ||
| 6 | PDLIM1 | 450100 | 696 | 0.511 | 0.7511 | Yes | ||
| 7 | MTL5 | 6940300 | 847 | 0.454 | 0.7746 | Yes | ||
| 8 | STK25 | 1090519 1500193 | 1008 | 0.398 | 0.7936 | Yes | ||
| 9 | CYBA | 4760739 | 1037 | 0.389 | 0.8191 | Yes | ||
| 10 | GSS | 6130465 6900398 | 1608 | 0.274 | 0.8076 | Yes | ||
| 11 | FOXM1 | 6650402 6980091 | 1702 | 0.261 | 0.8207 | Yes | ||
| 12 | CCL5 | 3710397 | 1721 | 0.258 | 0.8376 | Yes | ||
| 13 | LTC4S | 2570411 | 1750 | 0.254 | 0.8538 | Yes | ||
| 14 | NUDT1 | 2850600 | 2557 | 0.148 | 0.8207 | No | ||
| 15 | SOD1 | 5890070 | 4644 | 0.040 | 0.7113 | No | ||
| 16 | MSRA | 4570411 | 5256 | 0.030 | 0.6805 | No | ||
| 17 | SEPP1 | 450273 | 9682 | 0.003 | 0.4427 | No | ||
| 18 | NCF2 | 540129 2370441 2650133 | 9695 | 0.003 | 0.4422 | No | ||
| 19 | AOX1 | 110082 6290450 | 9720 | 0.003 | 0.4411 | No | ||
| 20 | CCS | 3450524 | 9849 | 0.002 | 0.4344 | No | ||
| 21 | NCF1 | 3850091 | 10615 | 0.000 | 0.3933 | No | ||
| 22 | SGK2 | 1850070 | 11458 | -0.002 | 0.3481 | No | ||
| 23 | ATOX1 | 1090497 | 13322 | -0.010 | 0.2487 | No | ||
| 24 | RPS6KA5 | 2120563 7040546 | 15421 | -0.055 | 0.1397 | No | ||
| 25 | SOD2 | 1410053 | 16447 | -0.142 | 0.0944 | No | ||
| 26 | OSR1 | 1500025 | 17352 | -0.319 | 0.0680 | No |