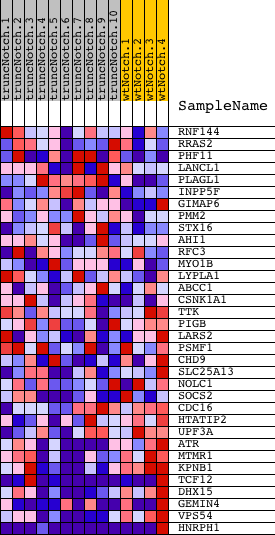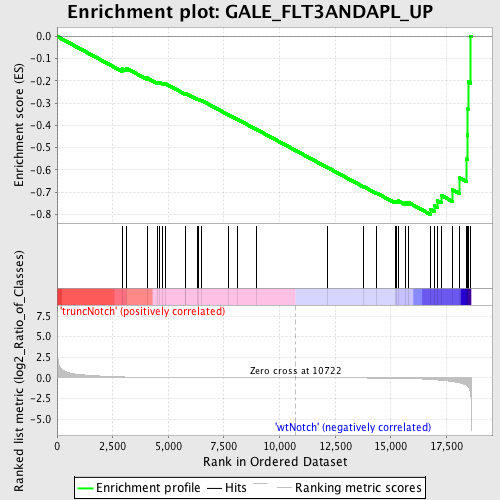
Profile of the Running ES Score & Positions of GeneSet Members on the Rank Ordered List
| Dataset | Set_03_truncNotch_versus_wtNotch.phenotype_truncNotch_versus_wtNotch.cls #truncNotch_versus_wtNotch |
| Phenotype | phenotype_truncNotch_versus_wtNotch.cls#truncNotch_versus_wtNotch |
| Upregulated in class | wtNotch |
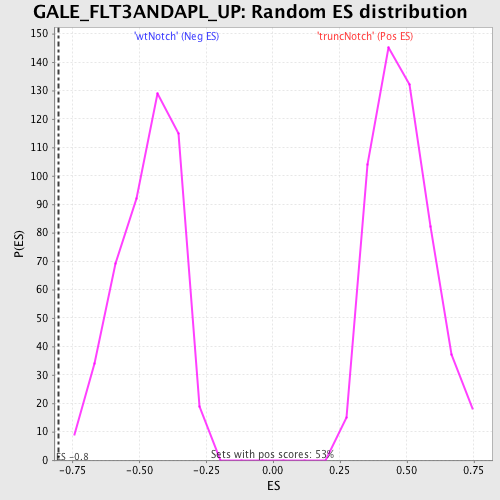
| GeneSet | GALE_FLT3ANDAPL_UP |
| Enrichment Score (ES) | -0.80011827 |
| Normalized Enrichment Score (NES) | -1.71176 |
| Nominal p-value | 0.0 |
| FDR q-value | 0.10009179 |
| FWER p-Value | 0.362 |
| PROBE | DESCRIPTION (from dataset) | GENE SYMBOL | GENE_TITLE | RANK IN GENE LIST | RANK METRIC SCORE | RUNNING ES | CORE ENRICHMENT | |
|---|---|---|---|---|---|---|---|---|
| 1 | RNF144 | 4210332 | 2954 | 0.110 | -0.1462 | No | ||
| 2 | RRAS2 | 6290170 | 3123 | 0.099 | -0.1437 | No | ||
| 3 | PHF11 | 630025 1170358 | 4042 | 0.056 | -0.1866 | No | ||
| 4 | LANCL1 | 1770079 6420670 | 4493 | 0.044 | -0.2057 | No | ||
| 5 | PLAGL1 | 3190082 6200193 | 4597 | 0.041 | -0.2065 | No | ||
| 6 | INPP5F | 60010 5360164 | 4737 | 0.039 | -0.2095 | No | ||
| 7 | GIMAP6 | 2470014 | 4867 | 0.036 | -0.2122 | No | ||
| 8 | PMM2 | 670673 2570044 2690093 4540068 6450056 | 5763 | 0.023 | -0.2577 | No | ||
| 9 | STX16 | 70315 | 5777 | 0.023 | -0.2557 | No | ||
| 10 | AHI1 | 460520 | 6304 | 0.018 | -0.2819 | No | ||
| 11 | RFC3 | 1980600 | 6368 | 0.018 | -0.2832 | No | ||
| 12 | MYO1B | 770372 | 6499 | 0.016 | -0.2883 | No | ||
| 13 | LYPLA1 | 4480373 5570551 | 7708 | 0.010 | -0.3522 | No | ||
| 14 | ABCC1 | 4760722 6770280 | 8102 | 0.008 | -0.3724 | No | ||
| 15 | CSNK1A1 | 2340427 | 8950 | 0.005 | -0.4174 | No | ||
| 16 | TTK | 3800129 | 12142 | -0.004 | -0.5886 | No | ||
| 17 | PIGB | 2850193 6380286 | 13783 | -0.014 | -0.6752 | No | ||
| 18 | LARS2 | 7000706 | 14360 | -0.022 | -0.7037 | No | ||
| 19 | PSMF1 | 5340056 | 15192 | -0.045 | -0.7432 | No | ||
| 20 | CHD9 | 430037 2570129 5420398 | 15256 | -0.048 | -0.7411 | No | ||
| 21 | SLC25A13 | 4920072 5690722 | 15328 | -0.050 | -0.7390 | No | ||
| 22 | NOLC1 | 2350195 | 15646 | -0.070 | -0.7480 | No | ||
| 23 | SOCS2 | 4760692 | 15787 | -0.080 | -0.7463 | No | ||
| 24 | CDC16 | 1940706 | 16789 | -0.194 | -0.7776 | Yes | ||
| 25 | HTATIP2 | 3120465 | 16957 | -0.224 | -0.7605 | Yes | ||
| 26 | UPF3A | 2360333 5340008 | 17090 | -0.250 | -0.7386 | Yes | ||
| 27 | ATR | 6860273 | 17259 | -0.292 | -0.7138 | Yes | ||
| 28 | MTMR1 | 1660131 | 17771 | -0.450 | -0.6890 | Yes | ||
| 29 | KPNB1 | 1690138 | 18073 | -0.602 | -0.6354 | Yes | ||
| 30 | TCF12 | 3610324 7000156 | 18397 | -0.880 | -0.5506 | Yes | ||
| 31 | DHX15 | 870632 | 18439 | -0.952 | -0.4424 | Yes | ||
| 32 | GEMIN4 | 130278 2230075 | 18461 | -1.013 | -0.3259 | Yes | ||
| 33 | VPS54 | 1660168 | 18477 | -1.061 | -0.2035 | Yes | ||
| 34 | HNRPH1 | 1170086 3140546 3290471 6110184 6110373 | 18591 | -1.818 | 0.0013 | Yes |