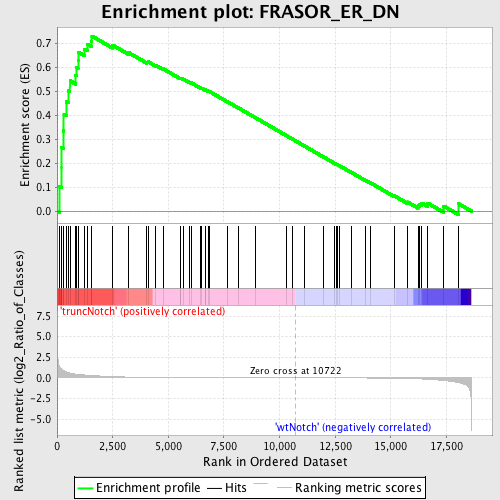
Profile of the Running ES Score & Positions of GeneSet Members on the Rank Ordered List
| Dataset | Set_03_truncNotch_versus_wtNotch.phenotype_truncNotch_versus_wtNotch.cls #truncNotch_versus_wtNotch |
| Phenotype | phenotype_truncNotch_versus_wtNotch.cls#truncNotch_versus_wtNotch |
| Upregulated in class | truncNotch |
| GeneSet | FRASOR_ER_DN |
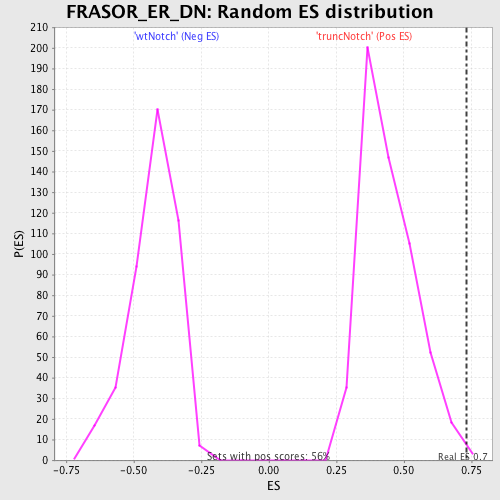
| Enrichment Score (ES) | 0.7305291 |
| Normalized Enrichment Score (NES) | 1.6552598 |
| Nominal p-value | 0.005357143 |
| FDR q-value | 0.18846537 |
| FWER p-Value | 0.643 |
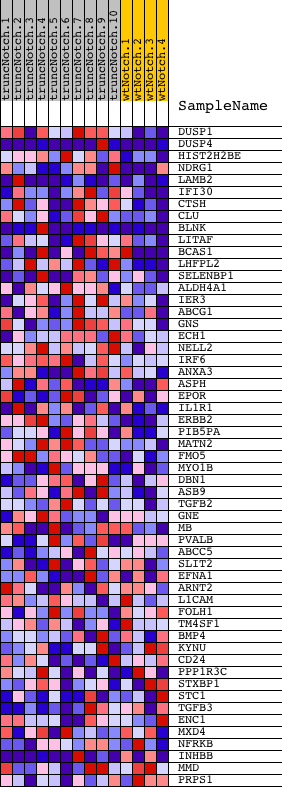
| PROBE | DESCRIPTION (from dataset) | GENE SYMBOL | GENE_TITLE | RANK IN GENE LIST | RANK METRIC SCORE | RUNNING ES | CORE ENRICHMENT | |
|---|---|---|---|---|---|---|---|---|
| 1 | DUSP1 | 6860121 | 115 | 1.337 | 0.1012 | Yes | ||
| 2 | DUSP4 | 2690044 2850593 | 199 | 1.050 | 0.1811 | Yes | ||
| 3 | HIST2H2BE | 3360184 | 201 | 1.046 | 0.2652 | Yes | ||
| 4 | NDRG1 | 1340040 | 280 | 0.922 | 0.3351 | Yes | ||
| 5 | LAMB2 | 4920184 | 308 | 0.882 | 0.4045 | Yes | ||
| 6 | IFI30 | 730309 2940500 | 410 | 0.716 | 0.4566 | Yes | ||
| 7 | CTSH | 60524 | 508 | 0.625 | 0.5016 | Yes | ||
| 8 | CLU | 5420075 | 579 | 0.576 | 0.5441 | Yes | ||
| 9 | BLNK | 70288 6590092 | 839 | 0.456 | 0.5668 | Yes | ||
| 10 | LITAF | 6940671 | 876 | 0.443 | 0.6004 | Yes | ||
| 11 | BCAS1 | 2030711 | 942 | 0.419 | 0.6306 | Yes | ||
| 12 | LHFPL2 | 450020 | 948 | 0.418 | 0.6639 | Yes | ||
| 13 | SELENBP1 | 3850575 | 1242 | 0.346 | 0.6760 | Yes | ||
| 14 | ALDH4A1 | 2450450 | 1356 | 0.324 | 0.6960 | Yes | ||
| 15 | IER3 | 5860021 | 1541 | 0.287 | 0.7091 | Yes | ||
| 16 | ABCG1 | 60692 | 1566 | 0.283 | 0.7305 | Yes | ||
| 17 | GNS | 3120458 | 2491 | 0.154 | 0.6931 | No | ||
| 18 | ECH1 | 4120746 | 3223 | 0.092 | 0.6611 | No | ||
| 19 | NELL2 | 2340725 4280301 5420008 | 4028 | 0.057 | 0.6224 | No | ||
| 20 | IRF6 | 840241 2640139 4050373 6840471 | 4089 | 0.055 | 0.6235 | No | ||
| 21 | ANXA3 | 5570494 | 4441 | 0.045 | 0.6082 | No | ||
| 22 | ASPH | 360722 1940039 2100066 2340121 2650113 2810064 2970008 3140040 3800750 4210014 4280133 4590035 4760433 6370671 6940338 | 4768 | 0.038 | 0.5937 | No | ||
| 23 | EPOR | 5290435 | 5536 | 0.026 | 0.5545 | No | ||
| 24 | IL1R1 | 3850377 6180128 | 5554 | 0.026 | 0.5557 | No | ||
| 25 | ERBB2 | 3830673 | 5669 | 0.024 | 0.5515 | No | ||
| 26 | PIB5PA | 6900427 | 5957 | 0.021 | 0.5377 | No | ||
| 27 | MATN2 | 460215 | 6019 | 0.021 | 0.5361 | No | ||
| 28 | FMO5 | 4810725 5390086 | 6435 | 0.017 | 0.5151 | No | ||
| 29 | MYO1B | 770372 | 6499 | 0.016 | 0.5130 | No | ||
| 30 | DBN1 | 7100537 | 6650 | 0.015 | 0.5062 | No | ||
| 31 | ASB9 | 6020500 | 6671 | 0.015 | 0.5063 | No | ||
| 32 | TGFB2 | 4920292 | 6784 | 0.015 | 0.5015 | No | ||
| 33 | GNE | 6100465 | 6861 | 0.014 | 0.4985 | No | ||
| 34 | MB | 730019 | 7641 | 0.010 | 0.4573 | No | ||
| 35 | PVALB | 5570450 | 8167 | 0.008 | 0.4297 | No | ||
| 36 | ABCC5 | 2100600 5050692 | 8895 | 0.005 | 0.3909 | No | ||
| 37 | SLIT2 | 1940037 | 10303 | 0.001 | 0.3152 | No | ||
| 38 | EFNA1 | 3840672 | 10588 | 0.000 | 0.3000 | No | ||
| 39 | ARNT2 | 1740594 | 11133 | -0.001 | 0.2707 | No | ||
| 40 | L1CAM | 4850021 | 11994 | -0.004 | 0.2247 | No | ||
| 41 | FOLH1 | 3290300 | 12462 | -0.006 | 0.2000 | No | ||
| 42 | TM4SF1 | 2570021 | 12575 | -0.006 | 0.1945 | No | ||
| 43 | BMP4 | 380113 | 12597 | -0.006 | 0.1939 | No | ||
| 44 | KYNU | 1410435 | 12697 | -0.007 | 0.1891 | No | ||
| 45 | CD24 | 1780091 | 13227 | -0.010 | 0.1613 | No | ||
| 46 | PPP1R3C | 2640170 | 13843 | -0.015 | 0.1294 | No | ||
| 47 | STXBP1 | 360072 6220717 | 14090 | -0.018 | 0.1176 | No | ||
| 48 | STC1 | 360161 | 15152 | -0.043 | 0.0639 | No | ||
| 49 | TGFB3 | 1070041 | 15747 | -0.077 | 0.0381 | No | ||
| 50 | ENC1 | 4810348 | 16223 | -0.117 | 0.0218 | No | ||
| 51 | MXD4 | 4810113 | 16283 | -0.123 | 0.0285 | No | ||
| 52 | NFRKB | 3130538 | 16390 | -0.135 | 0.0337 | No | ||
| 53 | INHBB | 2680092 | 16662 | -0.175 | 0.0331 | No | ||
| 54 | MMD | 3850239 | 17380 | -0.326 | 0.0207 | No | ||
| 55 | PRPS1 | 6350129 | 18029 | -0.570 | 0.0316 | No |