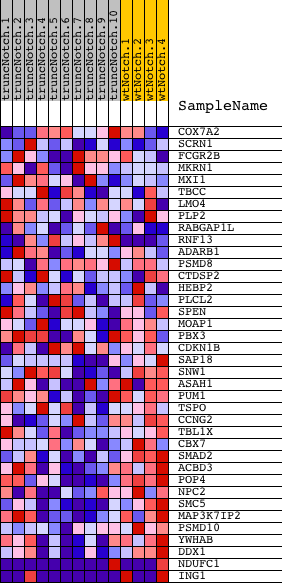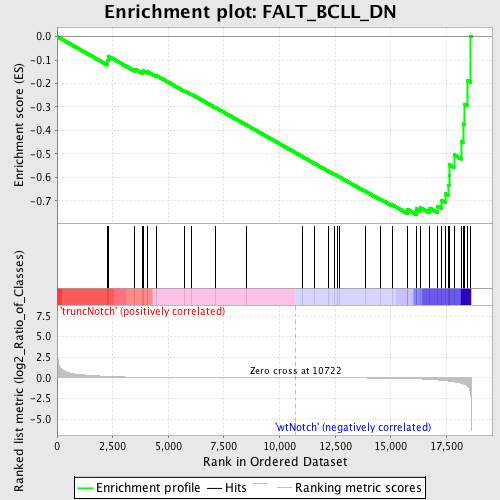
Profile of the Running ES Score & Positions of GeneSet Members on the Rank Ordered List
| Dataset | Set_03_truncNotch_versus_wtNotch.phenotype_truncNotch_versus_wtNotch.cls #truncNotch_versus_wtNotch |
| Phenotype | phenotype_truncNotch_versus_wtNotch.cls#truncNotch_versus_wtNotch |
| Upregulated in class | wtNotch |
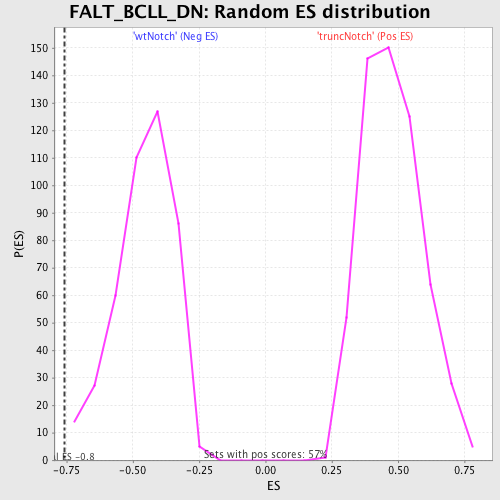
| GeneSet | FALT_BCLL_DN |
| Enrichment Score (ES) | -0.7583251 |
| Normalized Enrichment Score (NES) | -1.6586566 |
| Nominal p-value | 0.0023310024 |
| FDR q-value | 0.1463298 |
| FWER p-Value | 0.749 |
| PROBE | DESCRIPTION (from dataset) | GENE SYMBOL | GENE_TITLE | RANK IN GENE LIST | RANK METRIC SCORE | RUNNING ES | CORE ENRICHMENT | |
|---|---|---|---|---|---|---|---|---|
| 1 | COX7A2 | 4280114 | 2254 | 0.183 | -0.1010 | No | ||
| 2 | SCRN1 | 6040025 6580019 | 2302 | 0.177 | -0.0838 | No | ||
| 3 | FCGR2B | 780750 | 3487 | 0.078 | -0.1389 | No | ||
| 4 | MKRN1 | 1410097 | 3831 | 0.063 | -0.1504 | No | ||
| 5 | MXI1 | 5050064 5130484 | 3870 | 0.061 | -0.1456 | No | ||
| 6 | TBCC | 4810021 | 4074 | 0.055 | -0.1504 | No | ||
| 7 | LMO4 | 3800746 | 4468 | 0.045 | -0.1665 | No | ||
| 8 | PLP2 | 2100167 | 5736 | 0.024 | -0.2321 | No | ||
| 9 | RABGAP1L | 3190014 6860088 | 6050 | 0.020 | -0.2467 | No | ||
| 10 | RNF13 | 2370021 | 7125 | 0.012 | -0.3031 | No | ||
| 11 | ADARB1 | 780451 | 8492 | 0.007 | -0.3759 | No | ||
| 12 | PSMD8 | 630142 | 11012 | -0.001 | -0.5114 | No | ||
| 13 | CTDSP2 | 5340315 5690133 | 11558 | -0.002 | -0.5405 | No | ||
| 14 | HEBP2 | 1990309 | 12193 | -0.005 | -0.5741 | No | ||
| 15 | PLCL2 | 6100575 | 12478 | -0.006 | -0.5887 | No | ||
| 16 | SPEN | 2060041 | 12606 | -0.006 | -0.5948 | No | ||
| 17 | MOAP1 | 580537 | 12694 | -0.007 | -0.5988 | No | ||
| 18 | PBX3 | 1300424 3710577 6180575 | 13851 | -0.015 | -0.6593 | No | ||
| 19 | CDKN1B | 3800025 6450044 | 14515 | -0.024 | -0.6923 | No | ||
| 20 | SAP18 | 3610092 | 15068 | -0.040 | -0.7176 | No | ||
| 21 | SNW1 | 4010736 | 15740 | -0.076 | -0.7452 | No | ||
| 22 | ASAH1 | 510152 1340484 1740707 | 15756 | -0.078 | -0.7374 | No | ||
| 23 | PUM1 | 6130500 | 16146 | -0.109 | -0.7462 | Yes | ||
| 24 | TSPO | 110692 3390452 | 16151 | -0.109 | -0.7343 | Yes | ||
| 25 | CCNG2 | 3190095 | 16329 | -0.128 | -0.7296 | Yes | ||
| 26 | TBL1X | 6400524 | 16735 | -0.184 | -0.7309 | Yes | ||
| 27 | CBX7 | 3940035 | 17103 | -0.253 | -0.7225 | Yes | ||
| 28 | SMAD2 | 4200592 | 17271 | -0.295 | -0.6986 | Yes | ||
| 29 | ACBD3 | 2760170 | 17460 | -0.346 | -0.6702 | Yes | ||
| 30 | POP4 | 4560600 | 17601 | -0.388 | -0.6346 | Yes | ||
| 31 | NPC2 | 2350102 | 17627 | -0.401 | -0.5913 | Yes | ||
| 32 | SMC5 | 3440164 | 17646 | -0.408 | -0.5469 | Yes | ||
| 33 | MAP3K7IP2 | 2340242 | 17841 | -0.481 | -0.5038 | Yes | ||
| 34 | PSMD10 | 520494 1170576 3830050 | 18182 | -0.660 | -0.4486 | Yes | ||
| 35 | YWHAB | 1740176 | 18251 | -0.719 | -0.3722 | Yes | ||
| 36 | DDX1 | 3450047 | 18318 | -0.784 | -0.2885 | Yes | ||
| 37 | NDUFC1 | 2570377 4200239 | 18450 | -0.970 | -0.1876 | Yes | ||
| 38 | ING1 | 5690010 6520056 | 18583 | -1.765 | 0.0018 | Yes |