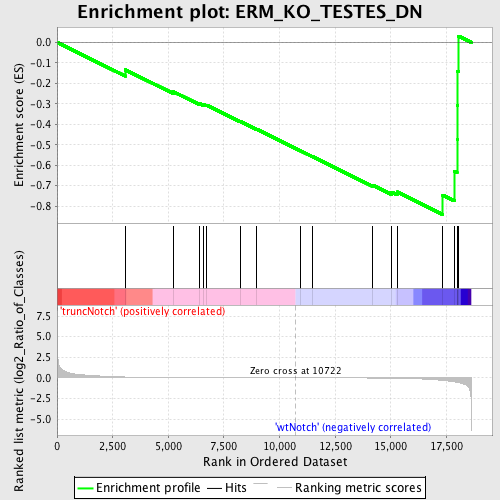
Profile of the Running ES Score & Positions of GeneSet Members on the Rank Ordered List
| Dataset | Set_03_truncNotch_versus_wtNotch.phenotype_truncNotch_versus_wtNotch.cls #truncNotch_versus_wtNotch |
| Phenotype | phenotype_truncNotch_versus_wtNotch.cls#truncNotch_versus_wtNotch |
| Upregulated in class | wtNotch |
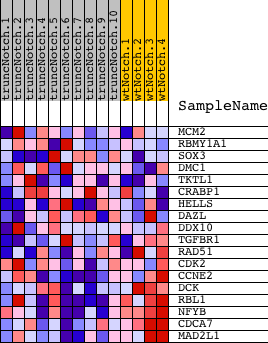
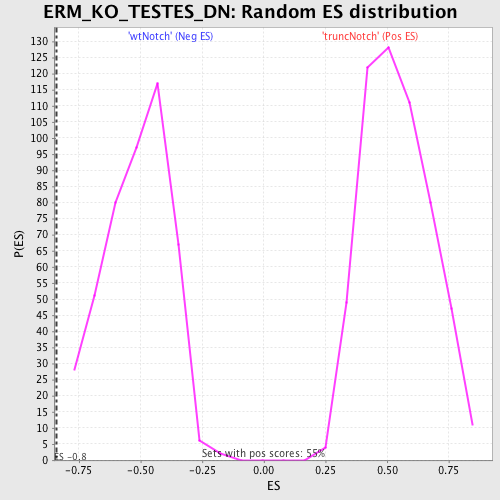
| GeneSet | ERM_KO_TESTES_DN |
| Enrichment Score (ES) | -0.8408249 |
| Normalized Enrichment Score (NES) | -1.6377711 |
| Nominal p-value | 0.0 |
| FDR q-value | 0.15159199 |
| FWER p-Value | 0.862 |
| PROBE | DESCRIPTION (from dataset) | GENE SYMBOL | GENE_TITLE | RANK IN GENE LIST | RANK METRIC SCORE | RUNNING ES | CORE ENRICHMENT | |
|---|---|---|---|---|---|---|---|---|
| 1 | MCM2 | 5050139 | 3062 | 0.103 | -0.1339 | No | ||
| 2 | RBMY1A1 | 6200053 | 5232 | 0.030 | -0.2414 | No | ||
| 3 | SOX3 | 4570537 | 6414 | 0.017 | -0.2998 | No | ||
| 4 | DMC1 | 450341 | 6598 | 0.016 | -0.3049 | No | ||
| 5 | TKTL1 | 2810672 6760102 | 6707 | 0.015 | -0.3062 | No | ||
| 6 | CRABP1 | 450278 | 8235 | 0.008 | -0.3861 | No | ||
| 7 | HELLS | 4560086 4810025 | 8978 | 0.005 | -0.4245 | No | ||
| 8 | DAZL | 4050082 | 10933 | -0.001 | -0.5293 | No | ||
| 9 | DDX10 | 520746 | 11484 | -0.002 | -0.5583 | No | ||
| 10 | TGFBR1 | 1400148 4280020 6550711 | 14173 | -0.019 | -0.6972 | No | ||
| 11 | RAD51 | 6110450 6980280 | 15032 | -0.039 | -0.7317 | No | ||
| 12 | CDK2 | 130484 2260301 4010088 5050110 | 15285 | -0.049 | -0.7307 | No | ||
| 13 | CCNE2 | 3120537 | 17335 | -0.315 | -0.7463 | Yes | ||
| 14 | DCK | 6900411 | 17856 | -0.485 | -0.6287 | Yes | ||
| 15 | RBL1 | 3130372 | 17978 | -0.543 | -0.4725 | Yes | ||
| 16 | NFYB | 1850053 | 17987 | -0.548 | -0.3086 | Yes | ||
| 17 | CDCA7 | 3060097 | 18003 | -0.558 | -0.1420 | Yes | ||
| 18 | MAD2L1 | 4480725 | 18047 | -0.583 | 0.0306 | Yes |