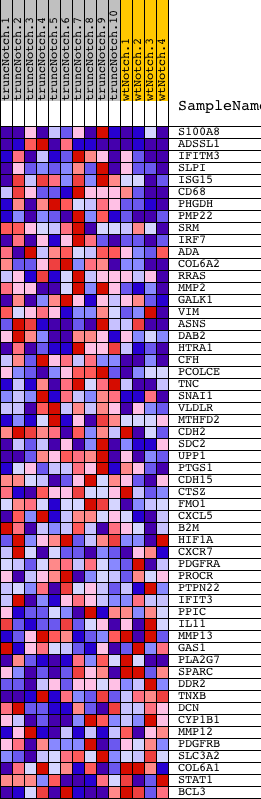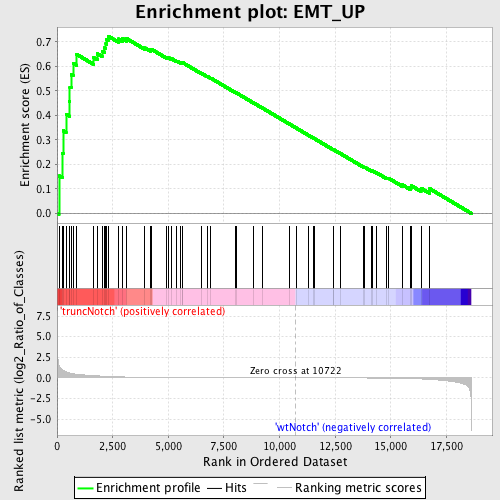
Profile of the Running ES Score & Positions of GeneSet Members on the Rank Ordered List
| Dataset | Set_03_truncNotch_versus_wtNotch.phenotype_truncNotch_versus_wtNotch.cls #truncNotch_versus_wtNotch |
| Phenotype | phenotype_truncNotch_versus_wtNotch.cls#truncNotch_versus_wtNotch |
| Upregulated in class | truncNotch |
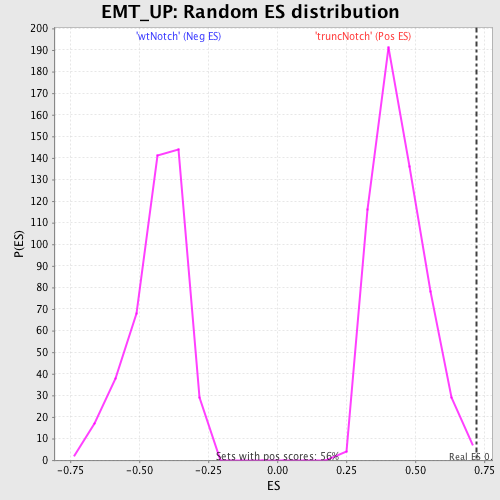
| GeneSet | EMT_UP |
| Enrichment Score (ES) | 0.7238764 |
| Normalized Enrichment Score (NES) | 1.6366903 |
| Nominal p-value | 0.0035650623 |
| FDR q-value | 0.15622649 |
| FWER p-Value | 0.789 |
| PROBE | DESCRIPTION (from dataset) | GENE SYMBOL | GENE_TITLE | RANK IN GENE LIST | RANK METRIC SCORE | RUNNING ES | CORE ENRICHMENT | |
|---|---|---|---|---|---|---|---|---|
| 1 | S100A8 | 70112 | 85 | 1.547 | 0.1529 | Yes | ||
| 2 | ADSSL1 | 4850132 7000288 | 230 | 0.987 | 0.2456 | Yes | ||
| 3 | IFITM3 | 2340358 | 272 | 0.930 | 0.3381 | Yes | ||
| 4 | SLPI | 2120446 | 404 | 0.723 | 0.4047 | Yes | ||
| 5 | ISG15 | 3170093 | 549 | 0.597 | 0.4577 | Yes | ||
| 6 | CD68 | 6350450 | 575 | 0.578 | 0.5152 | Yes | ||
| 7 | PHGDH | 1500280 | 632 | 0.536 | 0.5668 | Yes | ||
| 8 | PMP22 | 4010239 6550072 | 721 | 0.499 | 0.6129 | Yes | ||
| 9 | SRM | 1850097 2480162 | 879 | 0.442 | 0.6494 | Yes | ||
| 10 | IRF7 | 1570605 | 1645 | 0.268 | 0.6355 | Yes | ||
| 11 | ADA | 2120403 3130075 | 1808 | 0.245 | 0.6517 | Yes | ||
| 12 | COL6A2 | 1780142 | 2023 | 0.213 | 0.6619 | Yes | ||
| 13 | RRAS | 4150609 | 2139 | 0.197 | 0.6757 | Yes | ||
| 14 | MMP2 | 2570603 | 2193 | 0.190 | 0.6923 | Yes | ||
| 15 | GALK1 | 840162 | 2227 | 0.186 | 0.7095 | Yes | ||
| 16 | VIM | 20431 | 2295 | 0.177 | 0.7239 | Yes | ||
| 17 | ASNS | 110368 7100687 | 2752 | 0.128 | 0.7123 | No | ||
| 18 | DAB2 | 60309 | 2928 | 0.112 | 0.7143 | No | ||
| 19 | HTRA1 | 3450601 | 3129 | 0.099 | 0.7136 | No | ||
| 20 | CFH | 1240053 2030541 5900731 | 3946 | 0.059 | 0.6756 | No | ||
| 21 | PCOLCE | 4210433 | 4205 | 0.051 | 0.6669 | No | ||
| 22 | TNC | 670053 1780039 1980020 3060411 4780091 6860433 | 4234 | 0.050 | 0.6705 | No | ||
| 23 | SNAI1 | 6590253 | 4929 | 0.035 | 0.6367 | No | ||
| 24 | VLDLR | 870722 3060047 5340452 6550131 | 5018 | 0.033 | 0.6353 | No | ||
| 25 | MTHFD2 | 3800411 | 5145 | 0.031 | 0.6317 | No | ||
| 26 | CDH2 | 520435 2450451 2760025 6650477 | 5382 | 0.028 | 0.6219 | No | ||
| 27 | SDC2 | 1980168 | 5559 | 0.026 | 0.6150 | No | ||
| 28 | UPP1 | 3850358 3940100 | 5624 | 0.025 | 0.6141 | No | ||
| 29 | PTGS1 | 730193 1780273 6450195 | 5635 | 0.025 | 0.6161 | No | ||
| 30 | CDH15 | 460014 | 6476 | 0.017 | 0.5725 | No | ||
| 31 | CTSZ | 1500687 1690364 | 6748 | 0.015 | 0.5594 | No | ||
| 32 | FMO1 | 5360086 | 6913 | 0.014 | 0.5520 | No | ||
| 33 | CXCL5 | 6370333 | 7999 | 0.008 | 0.4944 | No | ||
| 34 | B2M | 5080332 5130059 | 8073 | 0.008 | 0.4913 | No | ||
| 35 | HIF1A | 5670605 | 8842 | 0.005 | 0.4505 | No | ||
| 36 | CXCR7 | 2630301 | 9253 | 0.004 | 0.4288 | No | ||
| 37 | PDGFRA | 2940332 | 10436 | 0.001 | 0.3652 | No | ||
| 38 | PROCR | 4920687 | 10764 | -0.000 | 0.3476 | No | ||
| 39 | PTPN22 | 1690647 7100239 | 11281 | -0.002 | 0.3200 | No | ||
| 40 | IFIT3 | 2450278 3190113 6200113 | 11515 | -0.002 | 0.3076 | No | ||
| 41 | PPIC | 4570110 | 11555 | -0.002 | 0.3058 | No | ||
| 42 | IL11 | 1740398 | 12421 | -0.006 | 0.2597 | No | ||
| 43 | MMP13 | 510471 3940097 | 12440 | -0.006 | 0.2593 | No | ||
| 44 | GAS1 | 2120504 | 12734 | -0.007 | 0.2443 | No | ||
| 45 | PLA2G7 | 4730092 | 13788 | -0.014 | 0.1890 | No | ||
| 46 | SPARC | 1690086 | 13824 | -0.015 | 0.1886 | No | ||
| 47 | DDR2 | 7050273 | 14118 | -0.018 | 0.1746 | No | ||
| 48 | TNXB | 630592 3830020 5360497 7000673 | 14176 | -0.019 | 0.1734 | No | ||
| 49 | DCN | 510332 5340026 5900711 6550092 | 14355 | -0.022 | 0.1660 | No | ||
| 50 | CYP1B1 | 4760735 | 14826 | -0.032 | 0.1440 | No | ||
| 51 | MMP12 | 4920070 | 14894 | -0.034 | 0.1438 | No | ||
| 52 | PDGFRB | 6450279 | 15511 | -0.061 | 0.1168 | No | ||
| 53 | SLC3A2 | 5270358 | 15876 | -0.086 | 0.1060 | No | ||
| 54 | COL6A1 | 1410670 2940091 6510086 | 15923 | -0.090 | 0.1127 | No | ||
| 55 | STAT1 | 6510204 6590553 | 16359 | -0.131 | 0.1025 | No | ||
| 56 | BCL3 | 3990440 | 16752 | -0.187 | 0.1004 | No |