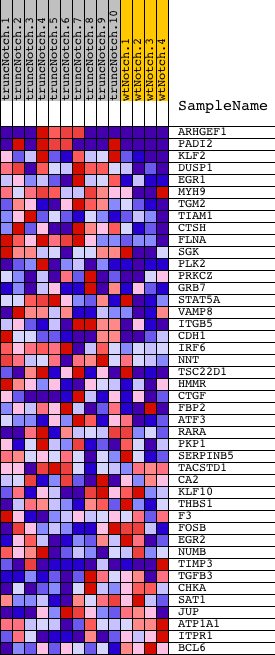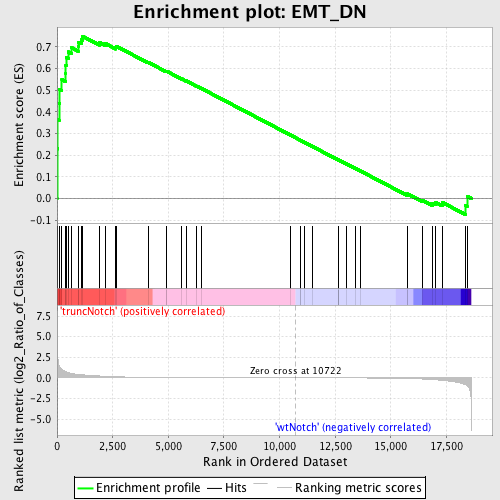
Profile of the Running ES Score & Positions of GeneSet Members on the Rank Ordered List
| Dataset | Set_03_truncNotch_versus_wtNotch.phenotype_truncNotch_versus_wtNotch.cls #truncNotch_versus_wtNotch |
| Phenotype | phenotype_truncNotch_versus_wtNotch.cls#truncNotch_versus_wtNotch |
| Upregulated in class | truncNotch |
| GeneSet | EMT_DN |
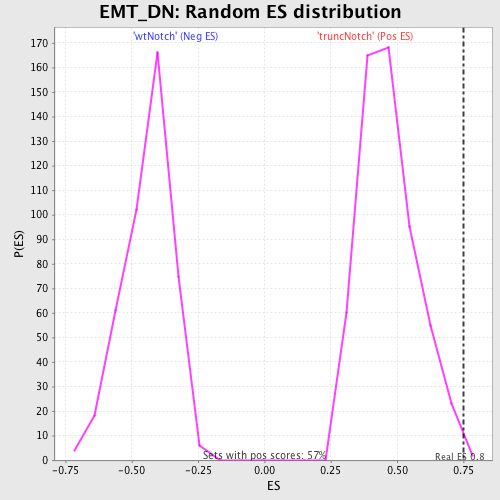
| Enrichment Score (ES) | 0.7501055 |
| Normalized Enrichment Score (NES) | 1.607429 |
| Nominal p-value | 0.0035211267 |
| FDR q-value | 0.22634967 |
| FWER p-Value | 0.928 |
| PROBE | DESCRIPTION (from dataset) | GENE SYMBOL | GENE_TITLE | RANK IN GENE LIST | RANK METRIC SCORE | RUNNING ES | CORE ENRICHMENT | |
|---|---|---|---|---|---|---|---|---|
| 1 | ARHGEF1 | 610347 4850603 6420672 | 4 | 4.545 | 0.2293 | Yes | ||
| 2 | PADI2 | 2940092 6420136 | 23 | 2.691 | 0.3642 | Yes | ||
| 3 | KLF2 | 6860270 | 91 | 1.525 | 0.4377 | Yes | ||
| 4 | DUSP1 | 6860121 | 115 | 1.337 | 0.5039 | Yes | ||
| 5 | EGR1 | 4610347 | 214 | 1.010 | 0.5496 | Yes | ||
| 6 | MYH9 | 3120091 4850292 | 382 | 0.754 | 0.5787 | Yes | ||
| 7 | TGM2 | 5360452 | 390 | 0.740 | 0.6157 | Yes | ||
| 8 | TIAM1 | 5420288 | 412 | 0.714 | 0.6506 | Yes | ||
| 9 | CTSH | 60524 | 508 | 0.625 | 0.6771 | Yes | ||
| 10 | FLNA | 5390193 | 637 | 0.535 | 0.6972 | Yes | ||
| 11 | SGK | 1400131 2480056 | 946 | 0.418 | 0.7017 | Yes | ||
| 12 | PLK2 | 6450152 | 956 | 0.416 | 0.7222 | Yes | ||
| 13 | PRKCZ | 3780279 | 1106 | 0.373 | 0.7330 | Yes | ||
| 14 | GRB7 | 2100471 | 1133 | 0.366 | 0.7501 | Yes | ||
| 15 | STAT5A | 2680458 | 1906 | 0.230 | 0.7201 | No | ||
| 16 | VAMP8 | 380411 1190139 | 2178 | 0.192 | 0.7152 | No | ||
| 17 | ITGB5 | 70129 | 2639 | 0.139 | 0.6975 | No | ||
| 18 | CDH1 | 1940736 | 2664 | 0.136 | 0.7030 | No | ||
| 19 | IRF6 | 840241 2640139 4050373 6840471 | 4089 | 0.055 | 0.6291 | No | ||
| 20 | NNT | 540253 1170471 5550092 6760397 | 4904 | 0.036 | 0.5871 | No | ||
| 21 | TSC22D1 | 1340739 6040181 | 4906 | 0.036 | 0.5888 | No | ||
| 22 | HMMR | 5720315 6380168 | 5601 | 0.025 | 0.5527 | No | ||
| 23 | CTGF | 4540577 | 5795 | 0.023 | 0.5435 | No | ||
| 24 | FBP2 | 1580193 | 6257 | 0.019 | 0.5196 | No | ||
| 25 | ATF3 | 1940546 | 6485 | 0.017 | 0.5082 | No | ||
| 26 | RARA | 4050161 | 10512 | 0.001 | 0.2915 | No | ||
| 27 | PKP1 | 1500433 | 10918 | -0.001 | 0.2697 | No | ||
| 28 | SERPINB5 | 6940050 | 10942 | -0.001 | 0.2685 | No | ||
| 29 | TACSTD1 | 3780025 | 11131 | -0.001 | 0.2584 | No | ||
| 30 | CA2 | 1660113 1660600 | 11477 | -0.002 | 0.2400 | No | ||
| 31 | KLF10 | 4850056 | 12626 | -0.006 | 0.1785 | No | ||
| 32 | THBS1 | 4560494 430288 | 12659 | -0.007 | 0.1771 | No | ||
| 33 | F3 | 2940180 | 12668 | -0.007 | 0.1770 | No | ||
| 34 | FOSB | 1940142 | 13004 | -0.008 | 0.1594 | No | ||
| 35 | EGR2 | 3800403 | 13422 | -0.011 | 0.1375 | No | ||
| 36 | NUMB | 2450735 3800253 6350040 | 13642 | -0.013 | 0.1264 | No | ||
| 37 | TIMP3 | 1450504 1980270 | 15744 | -0.077 | 0.0171 | No | ||
| 38 | TGFB3 | 1070041 | 15747 | -0.077 | 0.0209 | No | ||
| 39 | CHKA | 510324 | 16406 | -0.136 | -0.0077 | No | ||
| 40 | SAT1 | 4570463 | 16872 | -0.210 | -0.0221 | No | ||
| 41 | JUP | 2510671 | 17016 | -0.233 | -0.0180 | No | ||
| 42 | ATP1A1 | 5670451 | 17311 | -0.306 | -0.0184 | No | ||
| 43 | ITPR1 | 3450519 | 18349 | -0.823 | -0.0327 | No | ||
| 44 | BCL6 | 940100 | 18431 | -0.930 | 0.0100 | No |