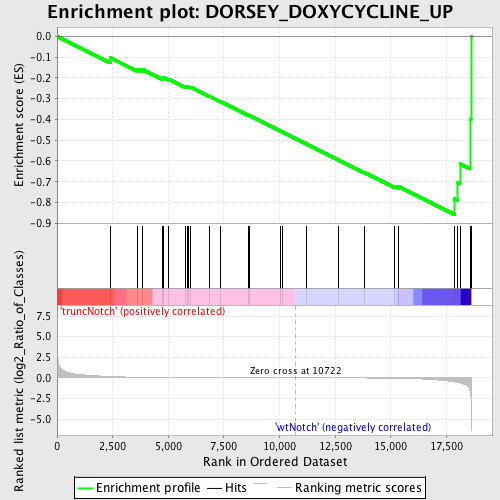
Profile of the Running ES Score & Positions of GeneSet Members on the Rank Ordered List
| Dataset | Set_03_truncNotch_versus_wtNotch.phenotype_truncNotch_versus_wtNotch.cls #truncNotch_versus_wtNotch |
| Phenotype | phenotype_truncNotch_versus_wtNotch.cls#truncNotch_versus_wtNotch |
| Upregulated in class | wtNotch |
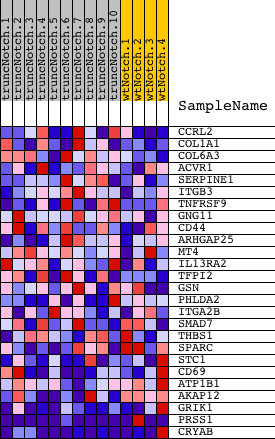
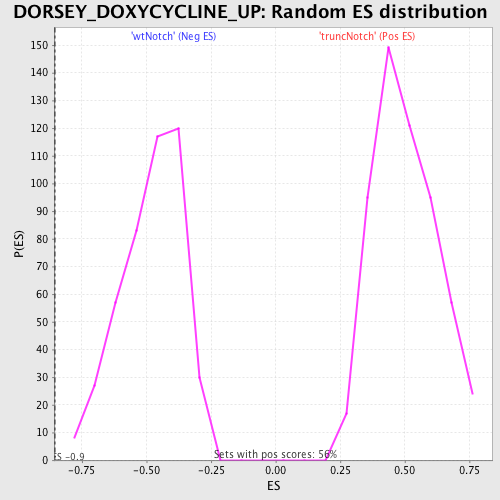
| GeneSet | DORSEY_DOXYCYCLINE_UP |
| Enrichment Score (ES) | -0.85731417 |
| Normalized Enrichment Score (NES) | -1.7847664 |
| Nominal p-value | 0.0 |
| FDR q-value | 0.074105896 |
| FWER p-Value | 0.065 |
| PROBE | DESCRIPTION (from dataset) | GENE SYMBOL | GENE_TITLE | RANK IN GENE LIST | RANK METRIC SCORE | RUNNING ES | CORE ENRICHMENT | |
|---|---|---|---|---|---|---|---|---|
| 1 | CCRL2 | 4760471 | 2392 | 0.165 | -0.1031 | No | ||
| 2 | COL1A1 | 730020 | 3617 | 0.071 | -0.1579 | No | ||
| 3 | COL6A3 | 2640717 4070064 5390717 | 3819 | 0.064 | -0.1589 | No | ||
| 4 | ACVR1 | 6840671 | 4738 | 0.039 | -0.2023 | No | ||
| 5 | SERPINE1 | 4210403 | 4784 | 0.038 | -0.1989 | No | ||
| 6 | ITGB3 | 5270463 | 5013 | 0.034 | -0.2059 | No | ||
| 7 | TNFRSF9 | 2510400 6650484 | 5770 | 0.023 | -0.2430 | No | ||
| 8 | GNG11 | 4010142 | 5853 | 0.022 | -0.2440 | No | ||
| 9 | CD44 | 3990072 4850671 5860411 6860148 7050551 | 5918 | 0.022 | -0.2441 | No | ||
| 10 | ARHGAP25 | 5080373 | 6007 | 0.021 | -0.2456 | No | ||
| 11 | MT4 | 4780338 | 6865 | 0.014 | -0.2895 | No | ||
| 12 | IL13RA2 | 2190577 | 7331 | 0.011 | -0.3128 | No | ||
| 13 | TFPI2 | 3870324 | 8607 | 0.006 | -0.3804 | No | ||
| 14 | GSN | 3830168 | 8632 | 0.006 | -0.3807 | No | ||
| 15 | PHLDA2 | 4810494 | 10046 | 0.002 | -0.4564 | No | ||
| 16 | ITGA2B | 2680538 | 10112 | 0.002 | -0.4597 | No | ||
| 17 | SMAD7 | 430377 | 11202 | -0.001 | -0.5180 | No | ||
| 18 | THBS1 | 4560494 430288 | 12659 | -0.007 | -0.5953 | No | ||
| 19 | SPARC | 1690086 | 13824 | -0.015 | -0.6557 | No | ||
| 20 | STC1 | 360161 | 15152 | -0.043 | -0.7204 | No | ||
| 21 | CD69 | 380167 4730088 | 15360 | -0.052 | -0.7234 | No | ||
| 22 | ATP1B1 | 3130594 | 17850 | -0.483 | -0.7826 | Yes | ||
| 23 | AKAP12 | 1450739 | 18010 | -0.561 | -0.7043 | Yes | ||
| 24 | GRIK1 | 1500707 6020463 | 18110 | -0.617 | -0.6142 | Yes | ||
| 25 | PRSS1 | 5860044 | 18559 | -1.545 | -0.3994 | Yes | ||
| 26 | CRYAB | 4810619 | 18607 | -2.602 | 0.0005 | Yes |