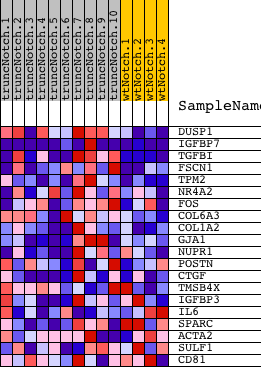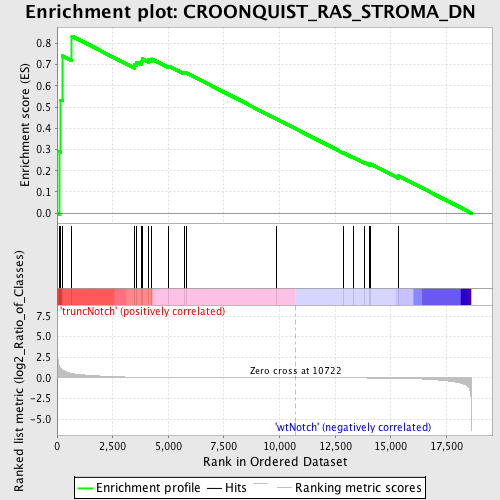
Profile of the Running ES Score & Positions of GeneSet Members on the Rank Ordered List
| Dataset | Set_03_truncNotch_versus_wtNotch.phenotype_truncNotch_versus_wtNotch.cls #truncNotch_versus_wtNotch |
| Phenotype | phenotype_truncNotch_versus_wtNotch.cls#truncNotch_versus_wtNotch |
| Upregulated in class | truncNotch |
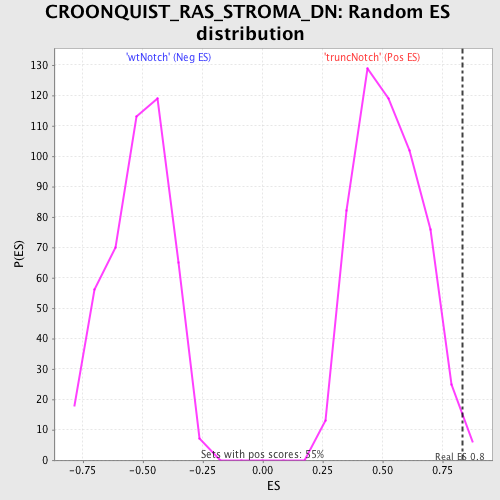
| GeneSet | CROONQUIST_RAS_STROMA_DN |
| Enrichment Score (ES) | 0.8346973 |
| Normalized Enrichment Score (NES) | 1.5908432 |
| Nominal p-value | 0.009057971 |
| FDR q-value | 0.22318348 |
| FWER p-Value | 0.98 |
| PROBE | DESCRIPTION (from dataset) | GENE SYMBOL | GENE_TITLE | RANK IN GENE LIST | RANK METRIC SCORE | RUNNING ES | CORE ENRICHMENT | |
|---|---|---|---|---|---|---|---|---|
| 1 | DUSP1 | 6860121 | 115 | 1.337 | 0.2903 | Yes | ||
| 2 | IGFBP7 | 520411 3060110 5290152 | 166 | 1.108 | 0.5334 | Yes | ||
| 3 | TGFBI | 2060446 6900112 | 250 | 0.957 | 0.7412 | Yes | ||
| 4 | FSCN1 | 3450463 | 667 | 0.522 | 0.8347 | Yes | ||
| 5 | TPM2 | 520735 3870390 | 3478 | 0.078 | 0.7009 | No | ||
| 6 | NR4A2 | 60273 | 3577 | 0.073 | 0.7118 | No | ||
| 7 | FOS | 1850315 | 3778 | 0.065 | 0.7155 | No | ||
| 8 | COL6A3 | 2640717 4070064 5390717 | 3819 | 0.064 | 0.7275 | No | ||
| 9 | COL1A2 | 380364 | 4111 | 0.054 | 0.7238 | No | ||
| 10 | GJA1 | 5220731 | 4258 | 0.049 | 0.7269 | No | ||
| 11 | NUPR1 | 1990524 | 5021 | 0.033 | 0.6933 | No | ||
| 12 | POSTN | 450411 6040451 | 5703 | 0.024 | 0.6620 | No | ||
| 13 | CTGF | 4540577 | 5795 | 0.023 | 0.6622 | No | ||
| 14 | TMSB4X | 6620114 | 9846 | 0.002 | 0.4450 | No | ||
| 15 | IGFBP3 | 2370500 | 12867 | -0.008 | 0.2842 | No | ||
| 16 | IL6 | 380133 | 13300 | -0.010 | 0.2633 | No | ||
| 17 | SPARC | 1690086 | 13824 | -0.015 | 0.2384 | No | ||
| 18 | ACTA2 | 60008 1230082 | 14057 | -0.017 | 0.2297 | No | ||
| 19 | SULF1 | 430575 | 14087 | -0.018 | 0.2321 | No | ||
| 20 | CD81 | 5270093 | 15350 | -0.051 | 0.1756 | No |