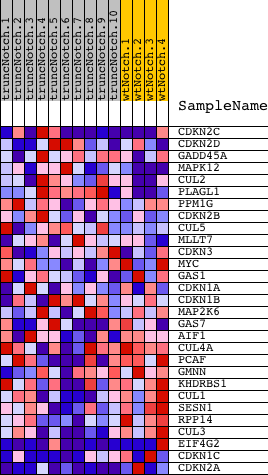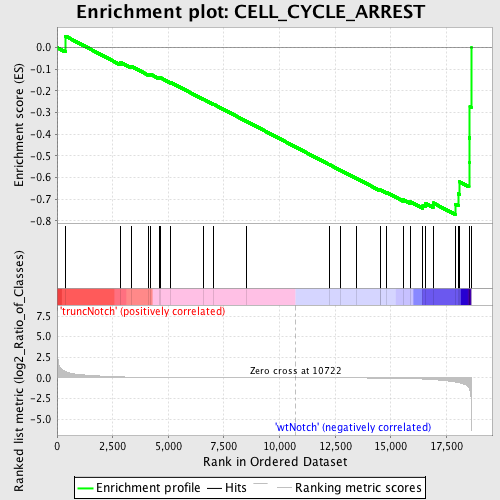
Profile of the Running ES Score & Positions of GeneSet Members on the Rank Ordered List
| Dataset | Set_03_truncNotch_versus_wtNotch.phenotype_truncNotch_versus_wtNotch.cls #truncNotch_versus_wtNotch |
| Phenotype | phenotype_truncNotch_versus_wtNotch.cls#truncNotch_versus_wtNotch |
| Upregulated in class | wtNotch |
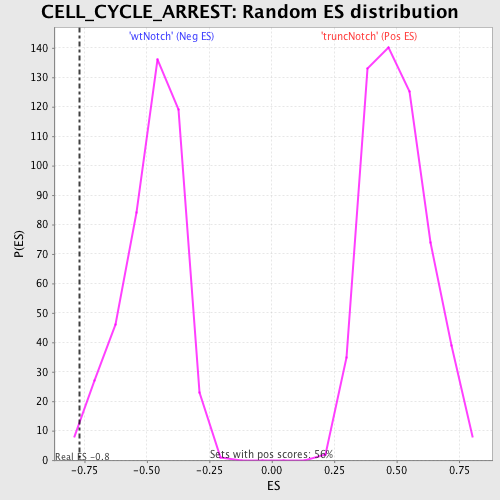
| GeneSet | CELL_CYCLE_ARREST |
| Enrichment Score (ES) | -0.7708863 |
| Normalized Enrichment Score (NES) | -1.6112137 |
| Nominal p-value | 0.0045045046 |
| FDR q-value | 0.17374358 |
| FWER p-Value | 0.946 |
| PROBE | DESCRIPTION (from dataset) | GENE SYMBOL | GENE_TITLE | RANK IN GENE LIST | RANK METRIC SCORE | RUNNING ES | CORE ENRICHMENT | |
|---|---|---|---|---|---|---|---|---|
| 1 | CDKN2C | 5050750 5130148 | 376 | 0.763 | 0.0528 | No | ||
| 2 | CDKN2D | 6040035 | 2854 | 0.118 | -0.0692 | No | ||
| 3 | GADD45A | 2900717 | 3324 | 0.086 | -0.0862 | No | ||
| 4 | MAPK12 | 450022 1340717 7050484 | 4113 | 0.054 | -0.1234 | No | ||
| 5 | CUL2 | 4200278 | 4216 | 0.051 | -0.1241 | No | ||
| 6 | PLAGL1 | 3190082 6200193 | 4597 | 0.041 | -0.1406 | No | ||
| 7 | PPM1G | 610725 | 4659 | 0.040 | -0.1400 | No | ||
| 8 | CDKN2B | 6020040 | 5117 | 0.032 | -0.1616 | No | ||
| 9 | CUL5 | 450142 | 6562 | 0.016 | -0.2377 | No | ||
| 10 | MLLT7 | 4480707 | 7050 | 0.013 | -0.2627 | No | ||
| 11 | CDKN3 | 110520 | 8494 | 0.007 | -0.3397 | No | ||
| 12 | MYC | 380541 4670170 | 12225 | -0.005 | -0.5399 | No | ||
| 13 | GAS1 | 2120504 | 12734 | -0.007 | -0.5666 | No | ||
| 14 | CDKN1A | 4050088 6400706 | 13471 | -0.011 | -0.6051 | No | ||
| 15 | CDKN1B | 3800025 6450044 | 14515 | -0.024 | -0.6589 | No | ||
| 16 | MAP2K6 | 1230056 2940204 | 14535 | -0.025 | -0.6575 | No | ||
| 17 | GAS7 | 2120358 6450494 | 14809 | -0.031 | -0.6692 | No | ||
| 18 | AIF1 | 130332 5220017 | 15550 | -0.064 | -0.7029 | No | ||
| 19 | CUL4A | 1170088 2320008 2470278 | 15889 | -0.087 | -0.7128 | No | ||
| 20 | PCAF | 2230161 2570369 6550451 | 16443 | -0.142 | -0.7290 | Yes | ||
| 21 | GMNN | 2630148 | 16570 | -0.161 | -0.7204 | Yes | ||
| 22 | KHDRBS1 | 1240403 6040040 | 16901 | -0.215 | -0.7176 | Yes | ||
| 23 | CUL1 | 1990632 | 17893 | -0.503 | -0.7228 | Yes | ||
| 24 | SESN1 | 2120021 | 18034 | -0.573 | -0.6755 | Yes | ||
| 25 | RPP14 | 7040014 | 18096 | -0.612 | -0.6203 | Yes | ||
| 26 | CUL3 | 1850520 | 18514 | -1.160 | -0.5317 | Yes | ||
| 27 | EIF4G2 | 3800575 6860184 | 18522 | -1.204 | -0.4170 | Yes | ||
| 28 | CDKN1C | 6520577 | 18557 | -1.527 | -0.2727 | Yes | ||
| 29 | CDKN2A | 4670215 4760047 | 18612 | -2.884 | 0.0002 | Yes |