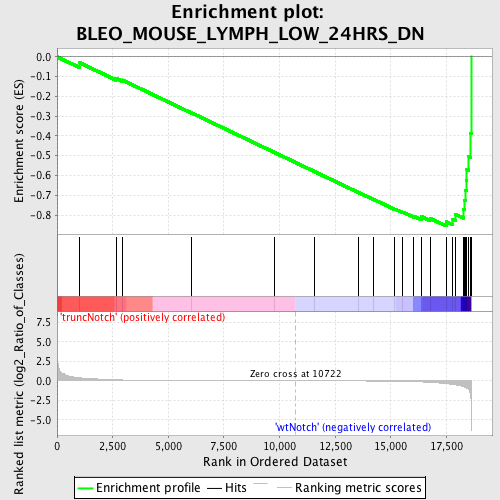
Profile of the Running ES Score & Positions of GeneSet Members on the Rank Ordered List
| Dataset | Set_03_truncNotch_versus_wtNotch.phenotype_truncNotch_versus_wtNotch.cls #truncNotch_versus_wtNotch |
| Phenotype | phenotype_truncNotch_versus_wtNotch.cls#truncNotch_versus_wtNotch |
| Upregulated in class | wtNotch |
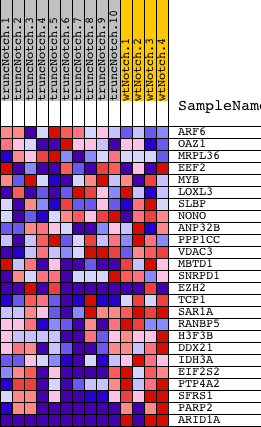
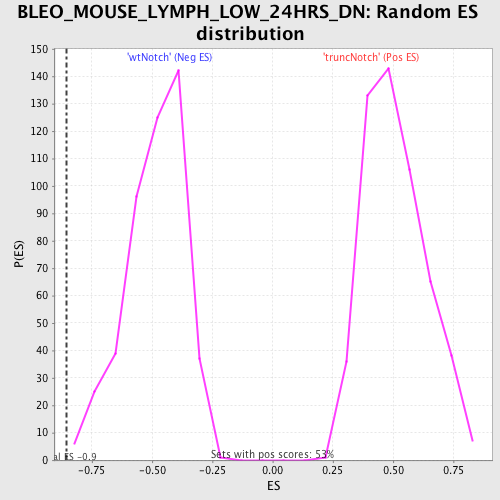
| GeneSet | BLEO_MOUSE_LYMPH_LOW_24HRS_DN |
| Enrichment Score (ES) | -0.8554531 |
| Normalized Enrichment Score (NES) | -1.7571831 |
| Nominal p-value | 0.0021231424 |
| FDR q-value | 0.052978873 |
| FWER p-Value | 0.138 |
| PROBE | DESCRIPTION (from dataset) | GENE SYMBOL | GENE_TITLE | RANK IN GENE LIST | RANK METRIC SCORE | RUNNING ES | CORE ENRICHMENT | |
|---|---|---|---|---|---|---|---|---|
| 1 | ARF6 | 3520026 | 994 | 0.404 | -0.0286 | No | ||
| 2 | OAZ1 | 110181 | 2649 | 0.138 | -0.1091 | No | ||
| 3 | MRPL36 | 1450048 | 2926 | 0.112 | -0.1171 | No | ||
| 4 | EEF2 | 1050369 4670035 5890598 | 6055 | 0.020 | -0.2841 | No | ||
| 5 | MYB | 1660494 5860451 6130706 | 9777 | 0.003 | -0.4840 | No | ||
| 6 | LOXL3 | 4010168 | 11550 | -0.002 | -0.5792 | No | ||
| 7 | SLBP | 6220601 | 13526 | -0.012 | -0.6847 | No | ||
| 8 | NONO | 7050014 | 14221 | -0.019 | -0.7208 | No | ||
| 9 | ANP32B | 940095 2450494 4200368 | 15185 | -0.045 | -0.7699 | No | ||
| 10 | PPP1CC | 6380300 2510647 | 15544 | -0.063 | -0.7852 | No | ||
| 11 | VDAC3 | 5390088 | 16031 | -0.099 | -0.8053 | No | ||
| 12 | MBTD1 | 5910400 | 16366 | -0.132 | -0.8152 | No | ||
| 13 | SNRPD1 | 4480162 | 16367 | -0.133 | -0.8070 | No | ||
| 14 | EZH2 | 6130605 6380524 | 16764 | -0.189 | -0.8167 | No | ||
| 15 | TCP1 | 2450100 5130524 | 17486 | -0.352 | -0.8338 | Yes | ||
| 16 | SAR1A | 3450253 | 17785 | -0.458 | -0.8217 | Yes | ||
| 17 | RANBP5 | 3780019 | 17916 | -0.514 | -0.7971 | Yes | ||
| 18 | H3F3B | 1410300 | 18257 | -0.727 | -0.7706 | Yes | ||
| 19 | DDX21 | 6100446 | 18324 | -0.788 | -0.7257 | Yes | ||
| 20 | IDH3A | 460332 | 18355 | -0.833 | -0.6762 | Yes | ||
| 21 | EIF2S2 | 770095 2810487 | 18392 | -0.876 | -0.6242 | Yes | ||
| 22 | PTP4A2 | 870154 6040070 6130242 6760224 | 18417 | -0.915 | -0.5693 | Yes | ||
| 23 | SFRS1 | 2360440 | 18508 | -1.134 | -0.5044 | Yes | ||
| 24 | PARP2 | 4920039 6510097 1500750 | 18594 | -1.968 | -0.3879 | Yes | ||
| 25 | ARID1A | 2630022 1690551 4810110 | 18616 | -6.327 | 0.0000 | Yes |