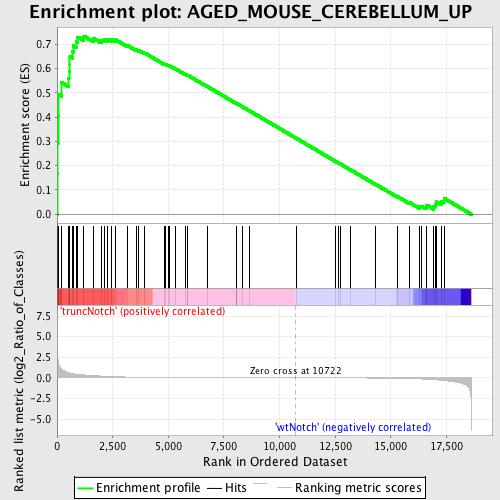
Profile of the Running ES Score & Positions of GeneSet Members on the Rank Ordered List
| Dataset | Set_03_truncNotch_versus_wtNotch.phenotype_truncNotch_versus_wtNotch.cls #truncNotch_versus_wtNotch |
| Phenotype | phenotype_truncNotch_versus_wtNotch.cls#truncNotch_versus_wtNotch |
| Upregulated in class | truncNotch |
| GeneSet | AGED_MOUSE_CEREBELLUM_UP |
| Enrichment Score (ES) | 0.7330694 |
| Normalized Enrichment Score (NES) | 1.646582 |
| Nominal p-value | 0.0017889087 |
| FDR q-value | 0.14525375 |
| FWER p-Value | 0.728 |
| PROBE | DESCRIPTION (from dataset) | GENE SYMBOL | GENE_TITLE | RANK IN GENE LIST | RANK METRIC SCORE | RUNNING ES | CORE ENRICHMENT | |
|---|---|---|---|---|---|---|---|---|
| 1 | SLC11A1 | 940286 2810435 6370647 | 15 | 3.189 | 0.1677 | Yes | ||
| 2 | TYMS | 940450 1940068 3710008 5570546 | 38 | 2.352 | 0.2908 | Yes | ||
| 3 | CDK4 | 540075 4540600 | 42 | 2.101 | 0.4017 | Yes | ||
| 4 | UBE2H | 1980142 2970079 | 60 | 1.747 | 0.4931 | Yes | ||
| 5 | APOE | 4200671 | 187 | 1.072 | 0.5430 | Yes | ||
| 6 | CTSH | 60524 | 508 | 0.625 | 0.5588 | Yes | ||
| 7 | LGALS3BP | 840692 | 535 | 0.606 | 0.5894 | Yes | ||
| 8 | CD68 | 6350450 | 575 | 0.578 | 0.6178 | Yes | ||
| 9 | AXL | 1770095 | 577 | 0.577 | 0.6483 | Yes | ||
| 10 | RHOG | 6760575 | 684 | 0.516 | 0.6698 | Yes | ||
| 11 | CST7 | 380369 | 735 | 0.495 | 0.6933 | Yes | ||
| 12 | LGALS3 | 2120239 | 852 | 0.451 | 0.7109 | Yes | ||
| 13 | PGLYRP1 | 6760242 | 929 | 0.423 | 0.7292 | Yes | ||
| 14 | CTSD | 1070195 | 1204 | 0.353 | 0.7331 | Yes | ||
| 15 | IRF7 | 1570605 | 1645 | 0.268 | 0.7235 | No | ||
| 16 | TRAPPC5 | 2320315 | 1991 | 0.218 | 0.7165 | No | ||
| 17 | F2 | 5720280 | 2123 | 0.199 | 0.7199 | No | ||
| 18 | TBC1D1 | 2510072 | 2277 | 0.180 | 0.7212 | No | ||
| 19 | GNB2 | 2350053 | 2441 | 0.159 | 0.7208 | No | ||
| 20 | ITGB5 | 70129 | 2639 | 0.139 | 0.7175 | No | ||
| 21 | IRGM | 6110148 6660685 | 3182 | 0.096 | 0.6934 | No | ||
| 22 | SLC7A3 | 60270 1400091 | 3555 | 0.074 | 0.6773 | No | ||
| 23 | EPS15 | 4200215 | 3674 | 0.069 | 0.6746 | No | ||
| 24 | CTSS | 1740056 | 3943 | 0.059 | 0.6632 | No | ||
| 25 | NOS3 | 630152 670465 | 4825 | 0.037 | 0.6177 | No | ||
| 26 | PTPRO | 1940576 6370332 | 4878 | 0.036 | 0.6168 | No | ||
| 27 | AGT | 7000575 | 4988 | 0.034 | 0.6127 | No | ||
| 28 | EFS | 110288 | 5073 | 0.033 | 0.6099 | No | ||
| 29 | PIGF | 5690050 | 5325 | 0.029 | 0.5979 | No | ||
| 30 | EIF2B5 | 430315 6900400 | 5773 | 0.023 | 0.5751 | No | ||
| 31 | GNG11 | 4010142 | 5853 | 0.022 | 0.5720 | No | ||
| 32 | THBS2 | 2850136 | 5868 | 0.022 | 0.5724 | No | ||
| 33 | CTSZ | 1500687 1690364 | 6748 | 0.015 | 0.5259 | No | ||
| 34 | GCK | 2370273 | 8063 | 0.008 | 0.4555 | No | ||
| 35 | B2M | 5080332 5130059 | 8073 | 0.008 | 0.4554 | No | ||
| 36 | SEZ6 | 3450722 | 8081 | 0.008 | 0.4555 | No | ||
| 37 | PTBP2 | 1240398 | 8354 | 0.007 | 0.4412 | No | ||
| 38 | WDFY3 | 3610041 4560333 4570273 | 8653 | 0.006 | 0.4255 | No | ||
| 39 | HEXB | 5860692 | 10779 | -0.000 | 0.3110 | No | ||
| 40 | GFAP | 2060092 | 12518 | -0.006 | 0.2177 | No | ||
| 41 | BDNF | 2940128 3520368 | 12639 | -0.007 | 0.2116 | No | ||
| 42 | TGFBR3 | 5290577 | 12759 | -0.007 | 0.2055 | No | ||
| 43 | EPRS | 3170301 | 13181 | -0.009 | 0.1833 | No | ||
| 44 | SNTA1 | 4570400 | 14332 | -0.021 | 0.1225 | No | ||
| 45 | IARS | 460528 1580739 1690008 | 15299 | -0.049 | 0.0731 | No | ||
| 46 | APC | 3850484 5860722 | 15817 | -0.082 | 0.0496 | No | ||
| 47 | ACADVL | 6040403 | 16284 | -0.123 | 0.0310 | No | ||
| 48 | TBX6 | 4730139 6840647 | 16379 | -0.134 | 0.0330 | No | ||
| 49 | SIPA1L2 | 4850731 | 16585 | -0.163 | 0.0305 | No | ||
| 50 | LMNB1 | 5890292 6020008 | 16609 | -0.167 | 0.0381 | No | ||
| 51 | CAPN2 | 430687 2360601 6980609 | 16928 | -0.219 | 0.0326 | No | ||
| 52 | NFYA | 5860368 | 16987 | -0.229 | 0.0416 | No | ||
| 53 | NOTCH1 | 3390114 | 17053 | -0.243 | 0.0509 | No | ||
| 54 | MNAT1 | 730292 2350364 | 17289 | -0.300 | 0.0541 | No | ||
| 55 | SPP1 | 2470609 | 17393 | -0.329 | 0.0659 | No |

