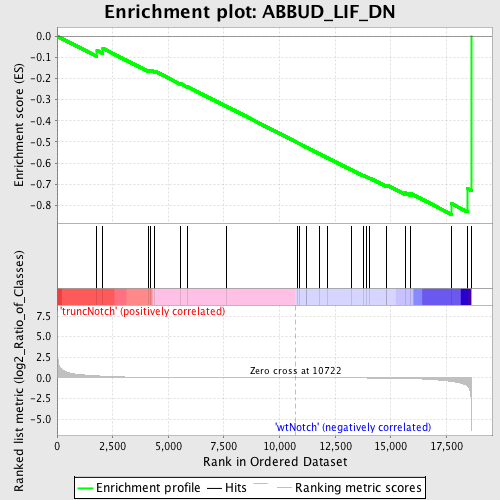
Profile of the Running ES Score & Positions of GeneSet Members on the Rank Ordered List
| Dataset | Set_03_truncNotch_versus_wtNotch.phenotype_truncNotch_versus_wtNotch.cls #truncNotch_versus_wtNotch |
| Phenotype | phenotype_truncNotch_versus_wtNotch.cls#truncNotch_versus_wtNotch |
| Upregulated in class | wtNotch |
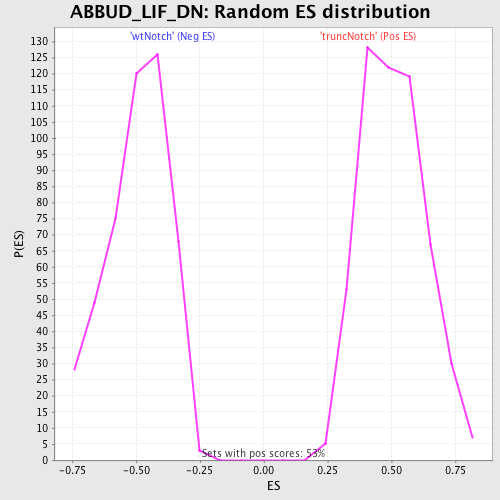
| GeneSet | ABBUD_LIF_DN |
| Enrichment Score (ES) | -0.842612 |
| Normalized Enrichment Score (NES) | -1.6964356 |
| Nominal p-value | 0.0 |
| FDR q-value | 0.11482785 |
| FWER p-Value | 0.464 |
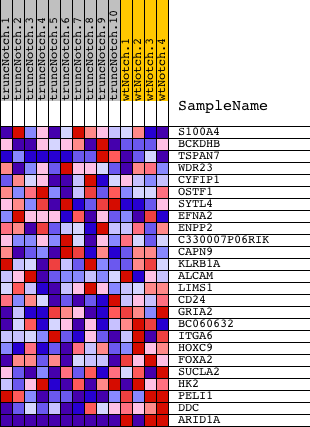
| PROBE | DESCRIPTION (from dataset) | GENE SYMBOL | GENE_TITLE | RANK IN GENE LIST | RANK METRIC SCORE | RUNNING ES | CORE ENRICHMENT | |
|---|---|---|---|---|---|---|---|---|
| 1 | S100A4 | 3780113 | 1791 | 0.248 | -0.0677 | No | ||
| 2 | BCKDHB | 780372 | 2058 | 0.209 | -0.0579 | No | ||
| 3 | TSPAN7 | 870133 | 4097 | 0.054 | -0.1613 | No | ||
| 4 | WDR23 | 2030372 | 4192 | 0.051 | -0.1604 | No | ||
| 5 | CYFIP1 | 5690082 | 4379 | 0.046 | -0.1650 | No | ||
| 6 | OSTF1 | 6770309 | 5558 | 0.026 | -0.2254 | No | ||
| 7 | SYTL4 | 3060066 | 5879 | 0.022 | -0.2401 | No | ||
| 8 | EFNA2 | 460193 | 7625 | 0.010 | -0.3328 | No | ||
| 9 | ENPP2 | 5860546 | 10784 | -0.000 | -0.5026 | No | ||
| 10 | C330007P06RIK | 2760035 | 10908 | -0.001 | -0.5092 | No | ||
| 11 | CAPN9 | 3450097 5910687 | 11187 | -0.001 | -0.5240 | No | ||
| 12 | KLRB1A | 4120722 | 11193 | -0.001 | -0.5241 | No | ||
| 13 | ALCAM | 1050019 | 11782 | -0.003 | -0.5554 | No | ||
| 14 | LIMS1 | 110138 1450398 | 12172 | -0.005 | -0.5758 | No | ||
| 15 | CD24 | 1780091 | 13227 | -0.010 | -0.6313 | No | ||
| 16 | GRIA2 | 5080088 | 13763 | -0.014 | -0.6585 | No | ||
| 17 | BC060632 | 540091 | 13911 | -0.016 | -0.6646 | No | ||
| 18 | ITGA6 | 3830129 | 14056 | -0.017 | -0.6704 | No | ||
| 19 | HOXC9 | 1570040 | 14802 | -0.031 | -0.7069 | No | ||
| 20 | FOXA2 | 540338 5860441 | 14812 | -0.032 | -0.7037 | No | ||
| 21 | SUCLA2 | 730632 1170292 | 15647 | -0.070 | -0.7405 | No | ||
| 22 | HK2 | 2640722 | 15891 | -0.087 | -0.7435 | No | ||
| 23 | PELI1 | 3870215 6900040 | 17735 | -0.439 | -0.7920 | Yes | ||
| 24 | DDC | 670408 | 18437 | -0.948 | -0.7203 | Yes | ||
| 25 | ARID1A | 2630022 1690551 4810110 | 18616 | -6.327 | 0.0000 | Yes |