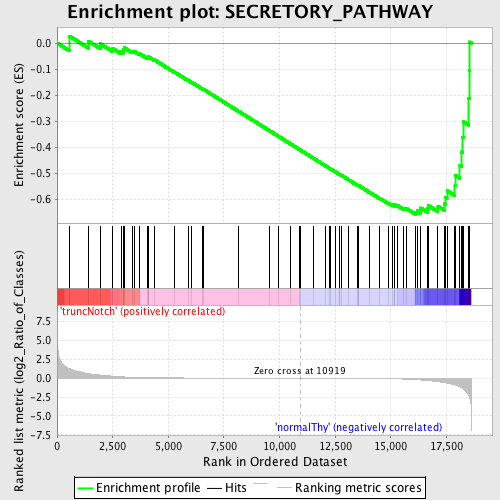
Profile of the Running ES Score & Positions of GeneSet Members on the Rank Ordered List
| Dataset | Set_03_truncNotch_versus_normalThy.phenotype_truncNotch_versus_normalThy.cls #truncNotch_versus_normalThy.phenotype_truncNotch_versus_normalThy.cls #truncNotch_versus_normalThy_repos |
| Phenotype | phenotype_truncNotch_versus_normalThy.cls#truncNotch_versus_normalThy_repos |
| Upregulated in class | normalThy |
| GeneSet | SECRETORY_PATHWAY |
| Enrichment Score (ES) | -0.65929824 |
| Normalized Enrichment Score (NES) | -1.5225092 |
| Nominal p-value | 0.0025252525 |
| FDR q-value | 0.77427816 |
| FWER p-Value | 0.992 |
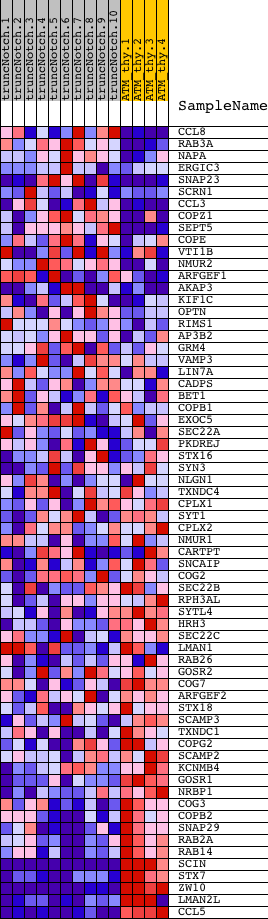
| PROBE | DESCRIPTION (from dataset) | GENE SYMBOL | GENE_TITLE | RANK IN GENE LIST | RANK METRIC SCORE | RUNNING ES | CORE ENRICHMENT | |
|---|---|---|---|---|---|---|---|---|
| 1 | CCL8 | 3870010 | 551 | 1.265 | 0.0266 | No | ||
| 2 | RAB3A | 3940288 | 1406 | 0.602 | 0.0074 | No | ||
| 3 | NAPA | 1780537 5720102 | 1940 | 0.418 | -0.0027 | No | ||
| 4 | ERGIC3 | 1400075 4780047 | 2499 | 0.265 | -0.0210 | No | ||
| 5 | SNAP23 | 2480722 5390315 | 2887 | 0.183 | -0.0338 | No | ||
| 6 | SCRN1 | 6040025 6580019 | 2972 | 0.169 | -0.0308 | No | ||
| 7 | CCL3 | 2810092 | 2985 | 0.168 | -0.0239 | No | ||
| 8 | COPZ1 | 6940100 | 3014 | 0.164 | -0.0182 | No | ||
| 9 | SEPT5 | 460725 | 3380 | 0.119 | -0.0325 | No | ||
| 10 | COPE | 2340088 2640450 6620279 | 3483 | 0.110 | -0.0331 | No | ||
| 11 | VTI1B | 3140364 6510497 | 3710 | 0.092 | -0.0412 | No | ||
| 12 | NMUR2 | 1580717 | 4066 | 0.073 | -0.0571 | No | ||
| 13 | ARFGEF1 | 6760494 | 4109 | 0.071 | -0.0562 | No | ||
| 14 | AKAP3 | 5890471 | 4115 | 0.071 | -0.0533 | No | ||
| 15 | KIF1C | 2480484 | 4379 | 0.059 | -0.0649 | No | ||
| 16 | OPTN | 3940041 | 5269 | 0.036 | -0.1112 | No | ||
| 17 | RIMS1 | 5670022 | 5901 | 0.025 | -0.1441 | No | ||
| 18 | AP3B2 | 4670605 | 6031 | 0.023 | -0.1501 | No | ||
| 19 | GRM4 | 6960092 | 6531 | 0.018 | -0.1761 | No | ||
| 20 | VAMP3 | 7100050 | 6559 | 0.018 | -0.1768 | No | ||
| 21 | LIN7A | 4540707 5270369 | 8147 | 0.009 | -0.2619 | No | ||
| 22 | CADPS | 2320181 | 9555 | 0.004 | -0.3376 | No | ||
| 23 | BET1 | 4010725 | 9934 | 0.003 | -0.3579 | No | ||
| 24 | COPB1 | 5390037 | 10505 | 0.001 | -0.3885 | No | ||
| 25 | EXOC5 | 7000711 | 10889 | 0.000 | -0.4092 | No | ||
| 26 | SEC22A | 3800162 3840168 5220164 5290632 | 10932 | -0.000 | -0.4114 | No | ||
| 27 | PKDREJ | 4200088 | 11517 | -0.002 | -0.4428 | No | ||
| 28 | STX16 | 70315 | 12083 | -0.004 | -0.4731 | No | ||
| 29 | SYN3 | 3290427 | 12247 | -0.004 | -0.4817 | No | ||
| 30 | NLGN1 | 5670278 | 12288 | -0.005 | -0.4837 | No | ||
| 31 | TXNDC4 | 450537 | 12515 | -0.006 | -0.4956 | No | ||
| 32 | CPLX1 | 2510735 | 12680 | -0.006 | -0.5042 | No | ||
| 33 | SYT1 | 840364 | 12700 | -0.006 | -0.5049 | No | ||
| 34 | CPLX2 | 6980538 | 12786 | -0.007 | -0.5092 | No | ||
| 35 | NMUR1 | 1500403 | 13099 | -0.009 | -0.5256 | No | ||
| 36 | CARTPT | 6660687 | 13495 | -0.012 | -0.5464 | No | ||
| 37 | SNCAIP | 4010551 | 13539 | -0.013 | -0.5481 | No | ||
| 38 | COG2 | 5900129 | 13554 | -0.013 | -0.5483 | No | ||
| 39 | SEC22B | 3190278 | 14030 | -0.019 | -0.5731 | No | ||
| 40 | RPH3AL | 70110 | 14481 | -0.031 | -0.5959 | No | ||
| 41 | SYTL4 | 3060066 | 14894 | -0.051 | -0.6159 | No | ||
| 42 | HRH3 | 6180040 | 15059 | -0.061 | -0.6220 | No | ||
| 43 | SEC22C | 1050600 6760050 | 15155 | -0.068 | -0.6241 | No | ||
| 44 | LMAN1 | 3420068 | 15178 | -0.070 | -0.6222 | No | ||
| 45 | RAB26 | 5910025 | 15291 | -0.079 | -0.6247 | No | ||
| 46 | GOSR2 | 1850059 1980687 4590184 | 15574 | -0.109 | -0.6350 | No | ||
| 47 | COG7 | 360133 | 15689 | -0.121 | -0.6358 | No | ||
| 48 | ARFGEF2 | 5550500 | 16126 | -0.181 | -0.6512 | Yes | ||
| 49 | STX18 | 4760706 | 16181 | -0.193 | -0.6456 | Yes | ||
| 50 | SCAMP3 | 2360707 | 16337 | -0.223 | -0.6440 | Yes | ||
| 51 | TXNDC1 | 520398 | 16345 | -0.225 | -0.6343 | Yes | ||
| 52 | COPG2 | 2370152 | 16647 | -0.306 | -0.6369 | Yes | ||
| 53 | SCAMP2 | 430114 | 16677 | -0.314 | -0.6245 | Yes | ||
| 54 | KCNMB4 | 3290347 | 17118 | -0.459 | -0.6278 | Yes | ||
| 55 | GOSR1 | 730279 | 17401 | -0.579 | -0.6173 | Yes | ||
| 56 | NRBP1 | 1740750 | 17465 | -0.617 | -0.5932 | Yes | ||
| 57 | COG3 | 3840746 | 17526 | -0.644 | -0.5677 | Yes | ||
| 58 | COPB2 | 610154 | 17883 | -0.876 | -0.5479 | Yes | ||
| 59 | SNAP29 | 6380239 | 17910 | -0.907 | -0.5090 | Yes | ||
| 60 | RAB2A | 2450358 | 18105 | -1.119 | -0.4696 | Yes | ||
| 61 | RAB14 | 6860139 | 18184 | -1.233 | -0.4189 | Yes | ||
| 62 | SCIN | 5420180 | 18226 | -1.318 | -0.3624 | Yes | ||
| 63 | STX7 | 5910484 | 18259 | -1.384 | -0.3026 | Yes | ||
| 64 | ZW10 | 2900735 3520687 | 18502 | -2.294 | -0.2135 | Yes | ||
| 65 | LMAN2L | 50079 6590100 6650338 | 18532 | -2.438 | -0.1065 | Yes | ||
| 66 | CCL5 | 3710397 | 18540 | -2.493 | 0.0041 | Yes |