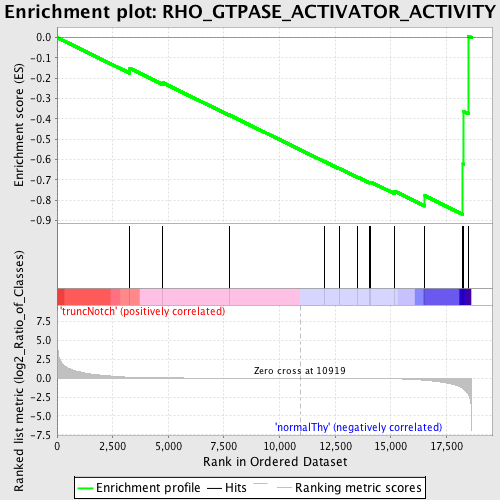
Profile of the Running ES Score & Positions of GeneSet Members on the Rank Ordered List
| Dataset | Set_03_truncNotch_versus_normalThy.phenotype_truncNotch_versus_normalThy.cls #truncNotch_versus_normalThy.phenotype_truncNotch_versus_normalThy.cls #truncNotch_versus_normalThy_repos |
| Phenotype | phenotype_truncNotch_versus_normalThy.cls#truncNotch_versus_normalThy_repos |
| Upregulated in class | normalThy |
| GeneSet | RHO_GTPASE_ACTIVATOR_ACTIVITY |
| Enrichment Score (ES) | -0.8710651 |
| Normalized Enrichment Score (NES) | -1.4823611 |
| Nominal p-value | 0.008948546 |
| FDR q-value | 0.57802963 |
| FWER p-Value | 0.999 |
| PROBE | DESCRIPTION (from dataset) | GENE SYMBOL | GENE_TITLE | RANK IN GENE LIST | RANK METRIC SCORE | RUNNING ES | CORE ENRICHMENT | |
|---|---|---|---|---|---|---|---|---|
| 1 | GMIP | 6980193 | 3269 | 0.131 | -0.1516 | No | ||
| 2 | DOCK4 | 5910102 | 4757 | 0.048 | -0.2228 | No | ||
| 3 | SOS1 | 7050338 | 7726 | 0.010 | -0.3804 | No | ||
| 4 | DEPDC2 | 5220102 | 12023 | -0.004 | -0.6107 | No | ||
| 5 | ARHGAP5 | 2510619 3360035 | 12685 | -0.006 | -0.6451 | No | ||
| 6 | ARHGAP10 | 510086 780324 | 13511 | -0.012 | -0.6871 | No | ||
| 7 | OPHN1 | 2360100 | 14052 | -0.020 | -0.7126 | No | ||
| 8 | CENTD2 | 60408 2510156 6100494 | 14100 | -0.021 | -0.7113 | No | ||
| 9 | CDC42EP2 | 540079 2970138 | 15160 | -0.068 | -0.7557 | No | ||
| 10 | THY1 | 5910162 | 16532 | -0.273 | -0.7791 | Yes | ||
| 11 | RALBP1 | 4780632 | 18243 | -1.354 | -0.6224 | Yes | ||
| 12 | ARHGAP4 | 1940022 | 18274 | -1.416 | -0.3638 | Yes | ||
| 13 | MYO9B | 1230435 3060358 | 18480 | -2.079 | 0.0073 | Yes |

