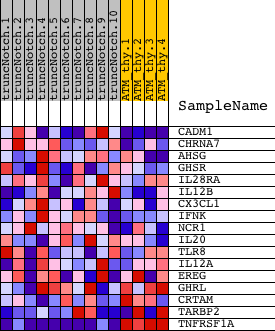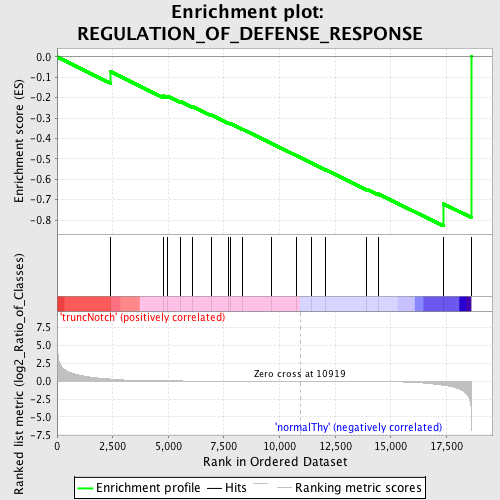
Profile of the Running ES Score & Positions of GeneSet Members on the Rank Ordered List
| Dataset | Set_03_truncNotch_versus_normalThy.phenotype_truncNotch_versus_normalThy.cls #truncNotch_versus_normalThy.phenotype_truncNotch_versus_normalThy.cls #truncNotch_versus_normalThy_repos |
| Phenotype | phenotype_truncNotch_versus_normalThy.cls#truncNotch_versus_normalThy_repos |
| Upregulated in class | normalThy |
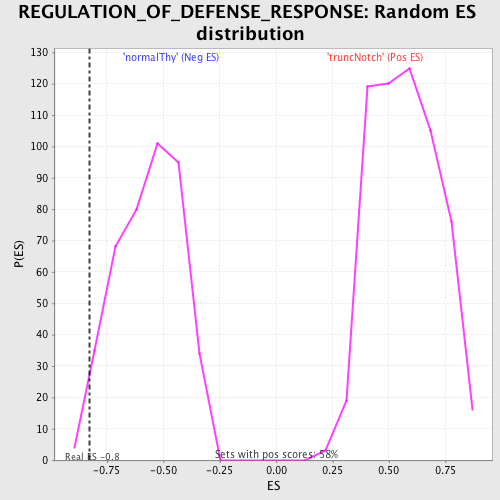
| GeneSet | REGULATION_OF_DEFENSE_RESPONSE |
| Enrichment Score (ES) | -0.82907325 |
| Normalized Enrichment Score (NES) | -1.4739386 |
| Nominal p-value | 0.026378896 |
| FDR q-value | 0.5779485 |
| FWER p-Value | 1.0 |
| PROBE | DESCRIPTION (from dataset) | GENE SYMBOL | GENE_TITLE | RANK IN GENE LIST | RANK METRIC SCORE | RUNNING ES | CORE ENRICHMENT | |
|---|---|---|---|---|---|---|---|---|
| 1 | CADM1 | 6620128 | 2389 | 0.294 | -0.0716 | No | ||
| 2 | CHRNA7 | 2970446 | 4779 | 0.047 | -0.1910 | No | ||
| 3 | AHSG | 6450014 | 4946 | 0.042 | -0.1917 | No | ||
| 4 | GHSR | 1980465 7050521 | 5535 | 0.031 | -0.2174 | No | ||
| 5 | IL28RA | 3710072 4920242 | 6088 | 0.023 | -0.2428 | No | ||
| 6 | IL12B | 460008 | 6924 | 0.015 | -0.2847 | No | ||
| 7 | CX3CL1 | 3990707 | 7694 | 0.011 | -0.3240 | No | ||
| 8 | IFNK | 5690064 | 7813 | 0.010 | -0.3284 | No | ||
| 9 | NCR1 | 2450026 | 8354 | 0.008 | -0.3559 | No | ||
| 10 | IL20 | 4850647 | 9632 | 0.004 | -0.4239 | No | ||
| 11 | TLR8 | 1240092 | 10752 | 0.000 | -0.4840 | No | ||
| 12 | IL12A | 7100551 | 11444 | -0.002 | -0.5208 | No | ||
| 13 | EREG | 50519 4920129 | 12084 | -0.004 | -0.5544 | No | ||
| 14 | GHRL | 2360619 6760438 | 13918 | -0.017 | -0.6496 | No | ||
| 15 | CRTAM | 4480110 | 14432 | -0.029 | -0.6716 | No | ||
| 16 | TARBP2 | 60369 380026 4760377 | 17362 | -0.563 | -0.7203 | Yes | ||
| 17 | TNFRSF1A | 1090390 6520735 | 18609 | -4.080 | 0.0004 | Yes |