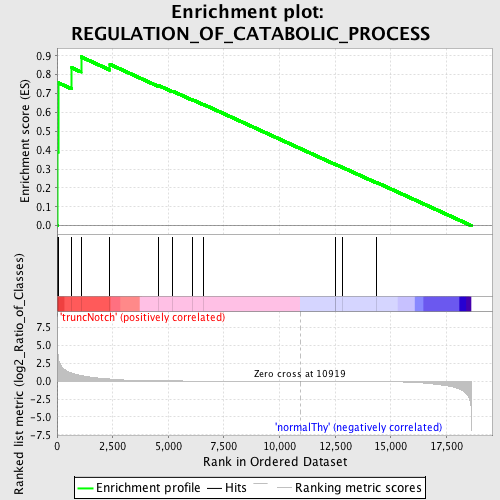
Profile of the Running ES Score & Positions of GeneSet Members on the Rank Ordered List
| Dataset | Set_03_truncNotch_versus_normalThy.phenotype_truncNotch_versus_normalThy.cls #truncNotch_versus_normalThy.phenotype_truncNotch_versus_normalThy.cls #truncNotch_versus_normalThy_repos |
| Phenotype | phenotype_truncNotch_versus_normalThy.cls#truncNotch_versus_normalThy_repos |
| Upregulated in class | truncNotch |
| GeneSet | REGULATION_OF_CATABOLIC_PROCESS |
| Enrichment Score (ES) | 0.8945105 |
| Normalized Enrichment Score (NES) | 1.4976617 |
| Nominal p-value | 0.009259259 |
| FDR q-value | 0.343984 |
| FWER p-Value | 0.999 |
| PROBE | DESCRIPTION (from dataset) | GENE SYMBOL | GENE_TITLE | RANK IN GENE LIST | RANK METRIC SCORE | RUNNING ES | CORE ENRICHMENT | |
|---|---|---|---|---|---|---|---|---|
| 1 | PFKM | 1990156 5720168 | 34 | 3.868 | 0.3889 | Yes | ||
| 2 | FAF1 | 2450717 2510121 4730156 | 40 | 3.653 | 0.7576 | Yes | ||
| 3 | PFKL | 6200167 | 661 | 1.110 | 0.8363 | Yes | ||
| 4 | STUB1 | 5860086 | 1074 | 0.795 | 0.8945 | Yes | ||
| 5 | EGLN2 | 540086 | 2375 | 0.298 | 0.8547 | No | ||
| 6 | GAPDHS | 2690463 | 4537 | 0.054 | 0.7440 | No | ||
| 7 | HGS | 5570722 | 5192 | 0.037 | 0.7126 | No | ||
| 8 | CIDEA | 4560020 | 6072 | 0.023 | 0.6677 | No | ||
| 9 | MDM4 | 4070504 4780008 | 6563 | 0.018 | 0.6431 | No | ||
| 10 | APOA5 | 6130471 | 12494 | -0.005 | 0.3249 | No | ||
| 11 | PPARA | 2060026 | 12517 | -0.006 | 0.3243 | No | ||
| 12 | ANGPTL3 | 6180497 | 12847 | -0.007 | 0.3074 | No | ||
| 13 | MDM2 | 3450053 5080138 | 14342 | -0.026 | 0.2297 | No |

