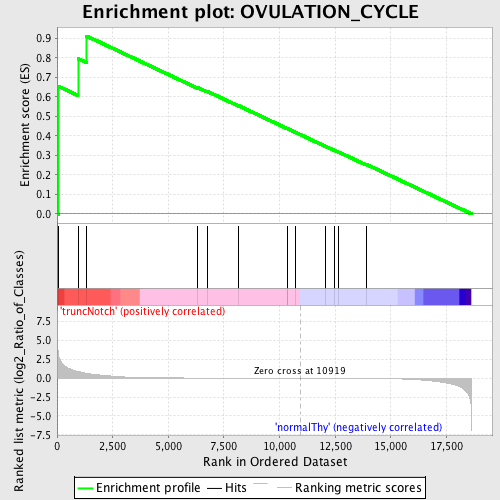
Profile of the Running ES Score & Positions of GeneSet Members on the Rank Ordered List
| Dataset | Set_03_truncNotch_versus_normalThy.phenotype_truncNotch_versus_normalThy.cls #truncNotch_versus_normalThy.phenotype_truncNotch_versus_normalThy.cls #truncNotch_versus_normalThy_repos |
| Phenotype | phenotype_truncNotch_versus_normalThy.cls#truncNotch_versus_normalThy_repos |
| Upregulated in class | truncNotch |
| GeneSet | OVULATION_CYCLE |
| Enrichment Score (ES) | 0.91105 |
| Normalized Enrichment Score (NES) | 1.5052695 |
| Nominal p-value | 0.005291005 |
| FDR q-value | 0.3371812 |
| FWER p-Value | 0.999 |
| PROBE | DESCRIPTION (from dataset) | GENE SYMBOL | GENE_TITLE | RANK IN GENE LIST | RANK METRIC SCORE | RUNNING ES | CORE ENRICHMENT | |
|---|---|---|---|---|---|---|---|---|
| 1 | EIF2B5 | 430315 6900400 | 63 | 3.070 | 0.6535 | Yes | ||
| 2 | EIF2B2 | 4290048 | 939 | 0.885 | 0.7958 | Yes | ||
| 3 | SOD1 | 5890070 | 1333 | 0.637 | 0.9111 | Yes | ||
| 4 | SPRR2G | 6550519 | 6297 | 0.020 | 0.6486 | No | ||
| 5 | EIF2B4 | 5270082 | 6740 | 0.017 | 0.6284 | No | ||
| 6 | SPRR2A | 360632 | 8162 | 0.009 | 0.5538 | No | ||
| 7 | SPRR2D | 1340458 | 10350 | 0.002 | 0.4366 | No | ||
| 8 | SPRR2E | 6620100 | 10367 | 0.002 | 0.4361 | No | ||
| 9 | BMPR1B | 4560010 4760121 6450161 | 10702 | 0.001 | 0.4183 | No | ||
| 10 | EREG | 50519 4920129 | 12084 | -0.004 | 0.3449 | No | ||
| 11 | SPRR2B | 60037 | 12480 | -0.005 | 0.3248 | No | ||
| 12 | SPRR2F | 670551 | 12662 | -0.006 | 0.3164 | No | ||
| 13 | FOXL2 | 5670537 | 13884 | -0.017 | 0.2544 | No |

