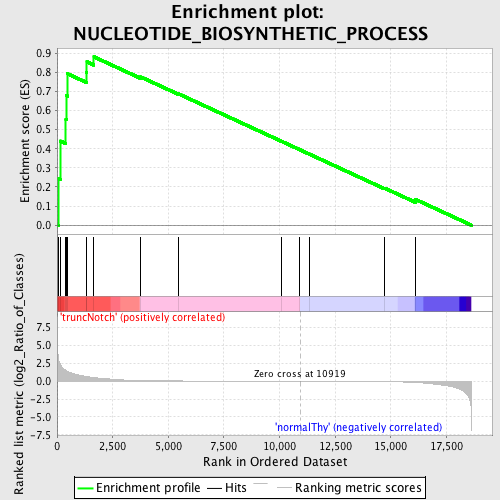
Profile of the Running ES Score & Positions of GeneSet Members on the Rank Ordered List
| Dataset | Set_03_truncNotch_versus_normalThy.phenotype_truncNotch_versus_normalThy.cls #truncNotch_versus_normalThy.phenotype_truncNotch_versus_normalThy.cls #truncNotch_versus_normalThy_repos |
| Phenotype | phenotype_truncNotch_versus_normalThy.cls#truncNotch_versus_normalThy_repos |
| Upregulated in class | truncNotch |
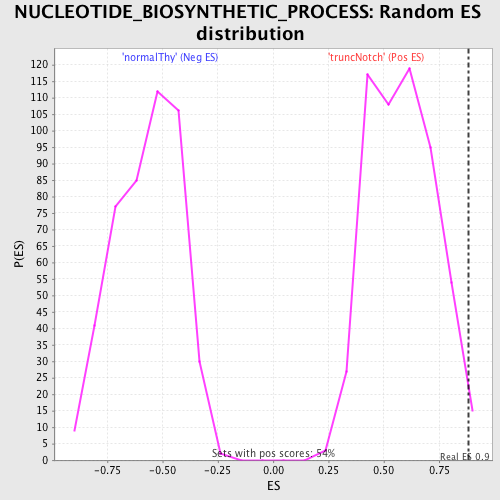
| GeneSet | NUCLEOTIDE_BIOSYNTHETIC_PROCESS |
| Enrichment Score (ES) | 0.88141656 |
| Normalized Enrichment Score (NES) | 1.5189838 |
| Nominal p-value | 0.0111524165 |
| FDR q-value | 0.3467423 |
| FWER p-Value | 0.989 |
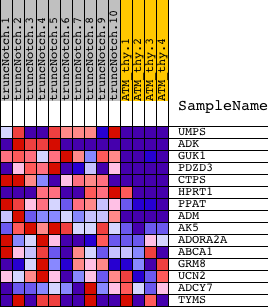
| PROBE | DESCRIPTION (from dataset) | GENE SYMBOL | GENE_TITLE | RANK IN GENE LIST | RANK METRIC SCORE | RUNNING ES | CORE ENRICHMENT | |
|---|---|---|---|---|---|---|---|---|
| 1 | UMPS | 2340541 4730438 | 79 | 2.871 | 0.2422 | Yes | ||
| 2 | ADK | 380338 520180 5270524 | 140 | 2.352 | 0.4408 | Yes | ||
| 3 | GUK1 | 5900059 | 396 | 1.495 | 0.5553 | Yes | ||
| 4 | PDZD3 | 630711 | 432 | 1.442 | 0.6772 | Yes | ||
| 5 | CTPS | 70451 1740132 | 471 | 1.368 | 0.7926 | Yes | ||
| 6 | HPRT1 | 1690398 4920619 6350170 | 1321 | 0.641 | 0.8020 | Yes | ||
| 7 | PPAT | 1980019 | 1342 | 0.632 | 0.8552 | Yes | ||
| 8 | ADM | 4810121 | 1657 | 0.502 | 0.8814 | Yes | ||
| 9 | AK5 | 6290348 | 3758 | 0.090 | 0.7762 | No | ||
| 10 | ADORA2A | 1990687 | 5457 | 0.032 | 0.6877 | No | ||
| 11 | ABCA1 | 6290156 | 10074 | 0.002 | 0.4398 | No | ||
| 12 | GRM8 | 4780082 | 10876 | 0.000 | 0.3967 | No | ||
| 13 | UCN2 | 4590372 | 11341 | -0.001 | 0.3719 | No | ||
| 14 | ADCY7 | 6290520 7560739 | 14735 | -0.042 | 0.1931 | No | ||
| 15 | TYMS | 940450 1940068 3710008 5570546 | 16115 | -0.180 | 0.1344 | No |