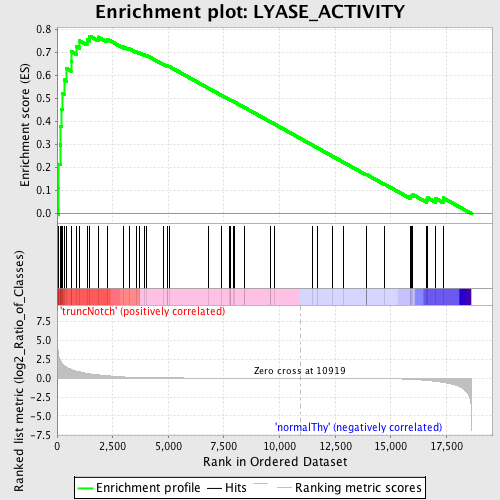
Profile of the Running ES Score & Positions of GeneSet Members on the Rank Ordered List
| Dataset | Set_03_truncNotch_versus_normalThy.phenotype_truncNotch_versus_normalThy.cls #truncNotch_versus_normalThy.phenotype_truncNotch_versus_normalThy.cls #truncNotch_versus_normalThy_repos |
| Phenotype | phenotype_truncNotch_versus_normalThy.cls#truncNotch_versus_normalThy_repos |
| Upregulated in class | truncNotch |
| GeneSet | LYASE_ACTIVITY |
| Enrichment Score (ES) | 0.77159667 |
| Normalized Enrichment Score (NES) | 1.6389123 |
| Nominal p-value | 0.001633987 |
| FDR q-value | 0.123987794 |
| FWER p-Value | 0.222 |
| PROBE | DESCRIPTION (from dataset) | GENE SYMBOL | GENE_TITLE | RANK IN GENE LIST | RANK METRIC SCORE | RUNNING ES | CORE ENRICHMENT | |
|---|---|---|---|---|---|---|---|---|
| 1 | APEX1 | 3190519 | 70 | 2.994 | 0.1082 | Yes | ||
| 2 | UMPS | 2340541 4730438 | 79 | 2.871 | 0.2151 | Yes | ||
| 3 | ALAD | 780576 | 143 | 2.327 | 0.2987 | Yes | ||
| 4 | ENO1 | 5340128 | 161 | 2.215 | 0.3806 | Yes | ||
| 5 | ENO3 | 5270136 | 198 | 2.033 | 0.4546 | Yes | ||
| 6 | ALDOA | 6290672 | 242 | 1.875 | 0.5224 | Yes | ||
| 7 | DDC | 670408 | 313 | 1.670 | 0.5811 | Yes | ||
| 8 | NTHL1 | 4920148 | 406 | 1.482 | 0.6316 | Yes | ||
| 9 | MLYCD | 6760181 | 628 | 1.159 | 0.6630 | Yes | ||
| 10 | MVD | 2060717 | 651 | 1.123 | 0.7038 | Yes | ||
| 11 | ADSL | 5570484 | 876 | 0.932 | 0.7266 | Yes | ||
| 12 | LTC4S | 2570411 | 1010 | 0.845 | 0.7510 | Yes | ||
| 13 | ECHS1 | 2970184 | 1345 | 0.630 | 0.7566 | Yes | ||
| 14 | SCLY | 730497 | 1467 | 0.576 | 0.7716 | Yes | ||
| 15 | BCKDHA | 50189 | 1845 | 0.441 | 0.7678 | No | ||
| 16 | ACO1 | 50114 | 2245 | 0.332 | 0.7587 | No | ||
| 17 | BCKDHB | 780372 | 2995 | 0.166 | 0.7246 | No | ||
| 18 | CBS | 5420450 6660039 | 3233 | 0.135 | 0.7168 | No | ||
| 19 | GGCX | 770377 3990441 | 3555 | 0.104 | 0.7034 | No | ||
| 20 | CA1 | 1340204 | 3687 | 0.093 | 0.6999 | No | ||
| 21 | UROD | 2470494 | 3911 | 0.080 | 0.6909 | No | ||
| 22 | ASL | 1240601 5340309 5360082 | 4033 | 0.075 | 0.6871 | No | ||
| 23 | CA2 | 1660113 1660600 | 4793 | 0.046 | 0.6480 | No | ||
| 24 | CA4 | 130100 | 4944 | 0.042 | 0.6415 | No | ||
| 25 | GAD1 | 2360035 3140167 | 4956 | 0.042 | 0.6425 | No | ||
| 26 | OGG1 | 1940279 | 5045 | 0.040 | 0.6393 | No | ||
| 27 | GUCY1A2 | 1660441 | 6816 | 0.016 | 0.5445 | No | ||
| 28 | HADHA | 3190041 | 7405 | 0.012 | 0.5133 | No | ||
| 29 | PCK1 | 7000358 | 7742 | 0.010 | 0.4956 | No | ||
| 30 | AMD1 | 6290128 | 7794 | 0.010 | 0.4932 | No | ||
| 31 | ODC1 | 5670168 | 7808 | 0.010 | 0.4929 | No | ||
| 32 | ADCY8 | 6760519 | 7926 | 0.010 | 0.4869 | No | ||
| 33 | SDS | 110242 6380725 | 7991 | 0.009 | 0.4838 | No | ||
| 34 | ACMSD | 1450538 | 8429 | 0.008 | 0.4606 | No | ||
| 35 | HCCS | 670397 3170341 | 8439 | 0.008 | 0.4604 | No | ||
| 36 | CRYM | 3940528 | 9600 | 0.004 | 0.3980 | No | ||
| 37 | GUCY2F | 2450309 | 9605 | 0.004 | 0.3979 | No | ||
| 38 | GUCY1A3 | 110253 2640735 4070037 | 9769 | 0.003 | 0.3893 | No | ||
| 39 | AUH | 5570152 | 11458 | -0.002 | 0.2984 | No | ||
| 40 | ALDOB | 4730324 | 11700 | -0.002 | 0.2855 | No | ||
| 41 | GUCY2C | 110411 6110156 | 12382 | -0.005 | 0.2490 | No | ||
| 42 | HDC | 4150463 | 12861 | -0.007 | 0.2235 | No | ||
| 43 | GUCY1B3 | 2970020 | 13891 | -0.017 | 0.1687 | No | ||
| 44 | CA3 | 870687 5890390 | 13896 | -0.017 | 0.1691 | No | ||
| 45 | ALDOC | 450121 610427 | 13898 | -0.017 | 0.1697 | No | ||
| 46 | HADHB | 60064 2690670 | 13913 | -0.017 | 0.1696 | No | ||
| 47 | ADCY7 | 6290520 7560739 | 14735 | -0.042 | 0.1270 | No | ||
| 48 | FECH | 2810605 3120088 4920411 | 15870 | -0.144 | 0.0713 | No | ||
| 49 | GLO1 | 7040692 | 15880 | -0.145 | 0.0762 | No | ||
| 50 | EHHADH | 6200315 | 15948 | -0.156 | 0.0784 | No | ||
| 51 | ADCY9 | 5690168 | 15994 | -0.163 | 0.0821 | No | ||
| 52 | ENO2 | 2320068 | 16609 | -0.296 | 0.0601 | No | ||
| 53 | GMDS | 1050519 | 16640 | -0.303 | 0.0698 | No | ||
| 54 | ECH1 | 4120746 | 17017 | -0.420 | 0.0653 | No | ||
| 55 | PTS | 1500270 | 17350 | -0.557 | 0.0682 | No |

