Profile of the Running ES Score & Positions of GeneSet Members on the Rank Ordered List
| Dataset | Set_03_truncNotch_versus_normalThy.phenotype_truncNotch_versus_normalThy.cls #truncNotch_versus_normalThy.phenotype_truncNotch_versus_normalThy.cls #truncNotch_versus_normalThy_repos |
| Phenotype | phenotype_truncNotch_versus_normalThy.cls#truncNotch_versus_normalThy_repos |
| Upregulated in class | normalThy |
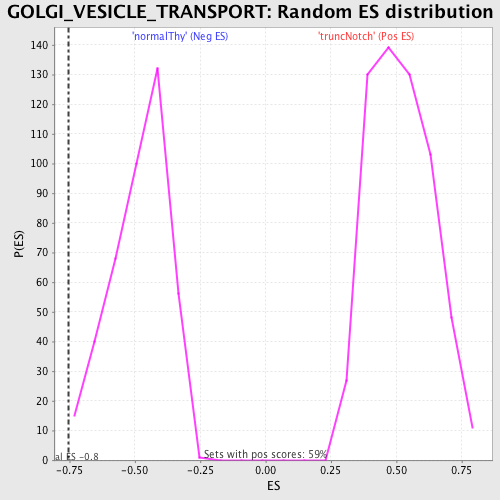
| GeneSet | GOLGI_VESICLE_TRANSPORT |
| Enrichment Score (ES) | -0.7555007 |
| Normalized Enrichment Score (NES) | -1.5729074 |
| Nominal p-value | 0.004854369 |
| FDR q-value | 0.441782 |
| FWER p-Value | 0.885 |
| PROBE | DESCRIPTION (from dataset) | GENE SYMBOL | GENE_TITLE | RANK IN GENE LIST | RANK METRIC SCORE | RUNNING ES | CORE ENRICHMENT | |
|---|---|---|---|---|---|---|---|---|
| 1 | NAPA | 1780537 5720102 | 1940 | 0.418 | -0.0757 | No | ||
| 2 | ERGIC3 | 1400075 4780047 | 2499 | 0.265 | -0.0876 | No | ||
| 3 | SNAP23 | 2480722 5390315 | 2887 | 0.183 | -0.0958 | No | ||
| 4 | COPZ1 | 6940100 | 3014 | 0.164 | -0.0914 | No | ||
| 5 | COPE | 2340088 2640450 6620279 | 3483 | 0.110 | -0.1090 | No | ||
| 6 | KIF1C | 2480484 | 4379 | 0.059 | -0.1531 | No | ||
| 7 | OPTN | 3940041 | 5269 | 0.036 | -0.1985 | No | ||
| 8 | AP3B2 | 4670605 | 6031 | 0.023 | -0.2379 | No | ||
| 9 | BET1 | 4010725 | 9934 | 0.003 | -0.4477 | No | ||
| 10 | COPB1 | 5390037 | 10505 | 0.001 | -0.4783 | No | ||
| 11 | EXOC5 | 7000711 | 10889 | 0.000 | -0.4989 | No | ||
| 12 | SEC22A | 3800162 3840168 5220164 5290632 | 10932 | -0.000 | -0.5011 | No | ||
| 13 | STX16 | 70315 | 12083 | -0.004 | -0.5628 | No | ||
| 14 | COG2 | 5900129 | 13554 | -0.013 | -0.6410 | No | ||
| 15 | SEC22B | 3190278 | 14030 | -0.019 | -0.6652 | No | ||
| 16 | SEC22C | 1050600 6760050 | 15155 | -0.068 | -0.7211 | No | ||
| 17 | LMAN1 | 3420068 | 15178 | -0.070 | -0.7175 | No | ||
| 18 | GOSR2 | 1850059 1980687 4590184 | 15574 | -0.109 | -0.7312 | No | ||
| 19 | COG7 | 360133 | 15689 | -0.121 | -0.7291 | No | ||
| 20 | STX18 | 4760706 | 16181 | -0.193 | -0.7423 | Yes | ||
| 21 | SCAMP3 | 2360707 | 16337 | -0.223 | -0.7353 | Yes | ||
| 22 | TXNDC1 | 520398 | 16345 | -0.225 | -0.7202 | Yes | ||
| 23 | COPG2 | 2370152 | 16647 | -0.306 | -0.7154 | Yes | ||
| 24 | SCAMP2 | 430114 | 16677 | -0.314 | -0.6954 | Yes | ||
| 25 | GOLGA5 | 6770301 | 17109 | -0.454 | -0.6874 | Yes | ||
| 26 | GOSR1 | 730279 | 17401 | -0.579 | -0.6633 | Yes | ||
| 27 | NRBP1 | 1740750 | 17465 | -0.617 | -0.6243 | Yes | ||
| 28 | COG3 | 3840746 | 17526 | -0.644 | -0.5833 | Yes | ||
| 29 | COPB2 | 610154 | 17883 | -0.876 | -0.5423 | Yes | ||
| 30 | RAB2A | 2450358 | 18105 | -1.119 | -0.4774 | Yes | ||
| 31 | RAB14 | 6860139 | 18184 | -1.233 | -0.3969 | Yes | ||
| 32 | STX7 | 5910484 | 18259 | -1.384 | -0.3058 | Yes | ||
| 33 | ZW10 | 2900735 3520687 | 18502 | -2.294 | -0.1613 | Yes | ||
| 34 | LMAN2L | 50079 6590100 6650338 | 18532 | -2.438 | 0.0045 | Yes |