Enrichment in phenotype: truncNotch (10 samples)
- 219 / 795 gene sets are upregulated in phenotype truncNotch
- 2 gene sets are significant at FDR < 25%
- 3 gene sets are significantly enriched at nominal pvalue < 1%
- 6 gene sets are significantly enriched at nominal pvalue < 5%
- Snapshot of enrichment results
- Detailed enrichment results in html format
- Detailed enrichment results in excel format (tab delimited text)
- Guide to interpret results
Enrichment in phenotype: normalThy (4 samples)
- 576 / 795 gene sets are upregulated in phenotype normalThy
- 201 gene sets are significantly enriched at FDR < 25%
- 92 gene sets are significantly enriched at nominal pvalue < 1%
- 173 gene sets are significantly enriched at nominal pvalue < 5%
- Snapshot of enrichment results
- Detailed enrichment results in html format
- Detailed enrichment results in excel format (tab delimited text)
- Guide to interpret results
Dataset details
- The dataset has 18617 features (genes)
- No probe set => gene symbol collapsing was requested, so all 18617 features were used
Gene set details
- Gene set size filters (min=10, max=500) resulted in filtering out 42 / 837 gene sets
- The remaining 795 gene sets were used in the analysis
- List of gene sets used and their sizes (restricted to features in the specified dataset)
Gene markers for the truncNotch versus normalThy comparison
- The dataset has 18617 features (genes)
- # of markers for phenotype truncNotch: 10919 (58.7% ) with correlation area 56.0%
- # of markers for phenotype normalThy: 7698 (41.3% ) with correlation area 44.0%
- Detailed rank ordered gene list for all features in the dataset
- Heat map and gene list correlation profile for all features in the dataset
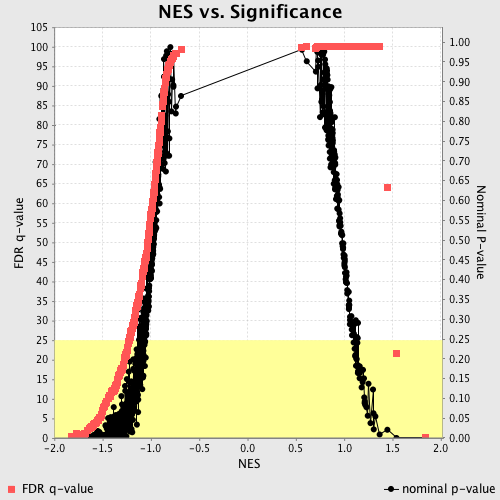
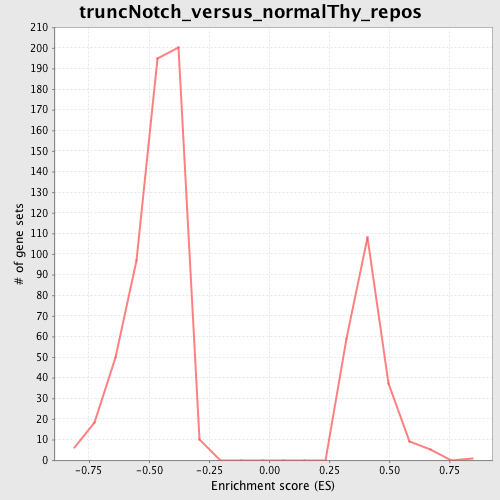
Global statistics and plots