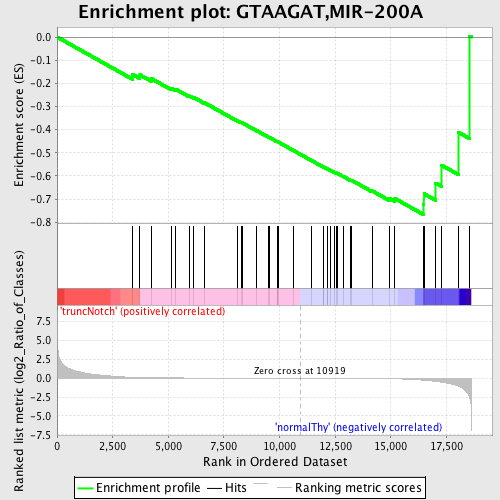
Profile of the Running ES Score & Positions of GeneSet Members on the Rank Ordered List
| Dataset | Set_03_truncNotch_versus_normalThy.phenotype_truncNotch_versus_normalThy.cls #truncNotch_versus_normalThy.phenotype_truncNotch_versus_normalThy.cls #truncNotch_versus_normalThy_repos |
| Phenotype | phenotype_truncNotch_versus_normalThy.cls#truncNotch_versus_normalThy_repos |
| Upregulated in class | normalThy |
| GeneSet | GTAAGAT,MIR-200A |
| Enrichment Score (ES) | -0.76658165 |
| Normalized Enrichment Score (NES) | -1.6322719 |
| Nominal p-value | 0.0025316456 |
| FDR q-value | 0.024167398 |
| FWER p-Value | 0.191 |
| PROBE | DESCRIPTION (from dataset) | GENE SYMBOL | GENE_TITLE | RANK IN GENE LIST | RANK METRIC SCORE | RUNNING ES | CORE ENRICHMENT | |
|---|---|---|---|---|---|---|---|---|
| 1 | CHD7 | 3870372 | 3399 | 0.117 | -0.1623 | No | ||
| 2 | A2BP1 | 2370390 4590593 5550014 | 3723 | 0.091 | -0.1636 | No | ||
| 3 | DLC1 | 1090632 6450594 | 4227 | 0.066 | -0.1791 | No | ||
| 4 | HNRPR | 2320440 2900601 4610008 | 5135 | 0.038 | -0.2212 | No | ||
| 5 | FURIN | 4120168 | 5335 | 0.035 | -0.2258 | No | ||
| 6 | HTR2C | 380497 | 5953 | 0.024 | -0.2547 | No | ||
| 7 | PPAP2B | 3190397 4730280 | 6149 | 0.022 | -0.2614 | No | ||
| 8 | NFIA | 2760129 5860278 | 6607 | 0.018 | -0.2829 | No | ||
| 9 | PAFAH1B1 | 4230333 6420121 6450066 | 8128 | 0.009 | -0.3632 | No | ||
| 10 | SHPRH | 3990458 | 8266 | 0.008 | -0.3691 | No | ||
| 11 | ARMC1 | 5220458 | 8320 | 0.008 | -0.3705 | No | ||
| 12 | POU4F2 | 2120195 2570022 | 8983 | 0.006 | -0.4052 | No | ||
| 13 | IPO7 | 2190746 | 9502 | 0.004 | -0.4324 | No | ||
| 14 | NR4A1 | 6290161 | 9539 | 0.004 | -0.4336 | No | ||
| 15 | PAX6 | 1190025 | 9898 | 0.003 | -0.4524 | No | ||
| 16 | FLRT3 | 70685 2760497 6040519 | 9914 | 0.003 | -0.4527 | No | ||
| 17 | QKI | 5220093 6130044 | 9948 | 0.003 | -0.4540 | No | ||
| 18 | FZD1 | 3140215 | 10613 | 0.001 | -0.4896 | No | ||
| 19 | UBQLN2 | 430397 1170594 4070121 | 11422 | -0.001 | -0.5328 | No | ||
| 20 | SLC39A14 | 670300 1400093 1990711 | 11983 | -0.003 | -0.5623 | No | ||
| 21 | TMSB4X | 6620114 | 11992 | -0.003 | -0.5622 | No | ||
| 22 | KCNS3 | 4150039 | 12137 | -0.004 | -0.5692 | No | ||
| 23 | PBEF1 | 1090278 | 12171 | -0.004 | -0.5703 | No | ||
| 24 | SP3 | 3840338 | 12266 | -0.004 | -0.5745 | No | ||
| 25 | HCN4 | 1050026 | 12460 | -0.005 | -0.5840 | No | ||
| 26 | FOXD1 | 6860053 | 12535 | -0.006 | -0.5870 | No | ||
| 27 | EGFL9 | 1410091 | 12608 | -0.006 | -0.5898 | No | ||
| 28 | UBE3A | 1240152 2690438 5860609 | 12858 | -0.007 | -0.6019 | No | ||
| 29 | HMGB1 | 2120670 2350044 | 13192 | -0.009 | -0.6182 | No | ||
| 30 | SP100 | 3440632 | 13252 | -0.010 | -0.6196 | No | ||
| 31 | KLF9 | 3840022 | 14167 | -0.022 | -0.6650 | No | ||
| 32 | PAPOLG | 2470400 | 14923 | -0.053 | -0.6962 | No | ||
| 33 | SFRS6 | 60224 | 15185 | -0.070 | -0.6978 | No | ||
| 34 | AMMECR1 | 3800435 | 16463 | -0.254 | -0.7218 | Yes | ||
| 35 | PURB | 5360138 | 16491 | -0.262 | -0.6771 | Yes | ||
| 36 | SGK | 1400131 2480056 | 17024 | -0.423 | -0.6312 | Yes | ||
| 37 | RAB1A | 2370671 | 17268 | -0.518 | -0.5529 | Yes | ||
| 38 | DYRK1A | 3190181 | 18053 | -1.036 | -0.4125 | Yes | ||
| 39 | FGF13 | 630575 1570440 5360121 | 18545 | -2.512 | 0.0038 | Yes |

