Profile of the Running ES Score & Positions of GeneSet Members on the Rank Ordered List
| Dataset | Set_03_absentNotch_versus_wtNotch.phenotype_absentNotch_versus_wtNotch.cls #absentNotch_versus_wtNotch.phenotype_absentNotch_versus_wtNotch.cls #absentNotch_versus_wtNotch_repos |
| Phenotype | phenotype_absentNotch_versus_wtNotch.cls#absentNotch_versus_wtNotch_repos |
| Upregulated in class | absentNotch |
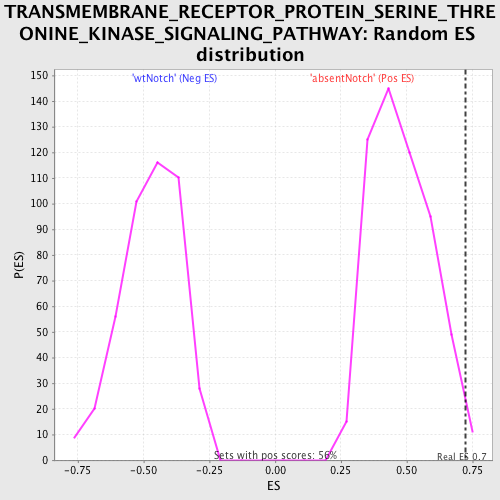
| GeneSet | TRANSMEMBRANE_RECEPTOR_PROTEIN_SERINE_THREONINE_KINASE_SIGNALING_PATHWAY |
| Enrichment Score (ES) | 0.7231685 |
| Normalized Enrichment Score (NES) | 1.5055068 |
| Nominal p-value | 0.01607143 |
| FDR q-value | 0.9413496 |
| FWER p-Value | 1.0 |
| PROBE | DESCRIPTION (from dataset) | GENE SYMBOL | GENE_TITLE | RANK IN GENE LIST | RANK METRIC SCORE | RUNNING ES | CORE ENRICHMENT | |
|---|---|---|---|---|---|---|---|---|
| 1 | CDKN1C | 6520577 | 180 | 0.990 | 0.2415 | Yes | ||
| 2 | ACVR2B | 1660546 | 389 | 0.601 | 0.3829 | Yes | ||
| 3 | LEFTY1 | 3290452 | 447 | 0.548 | 0.5190 | Yes | ||
| 4 | EID2 | 3130176 | 1195 | 0.242 | 0.5402 | Yes | ||
| 5 | SMAD5 | 5700497 | 1421 | 0.200 | 0.5788 | Yes | ||
| 6 | SMAD4 | 5670519 | 1447 | 0.194 | 0.6268 | Yes | ||
| 7 | STUB1 | 5860086 | 1526 | 0.182 | 0.6687 | Yes | ||
| 8 | SMAD3 | 6450671 | 1739 | 0.154 | 0.6963 | Yes | ||
| 9 | CITED2 | 5670114 5130088 | 2426 | 0.093 | 0.6829 | Yes | ||
| 10 | SMURF1 | 520609 580647 | 2644 | 0.079 | 0.6912 | Yes | ||
| 11 | HPGD | 6770192 | 2886 | 0.066 | 0.6949 | Yes | ||
| 12 | BMPR1A | 2190193 4060603 | 2968 | 0.062 | 0.7063 | Yes | ||
| 13 | ACVR1 | 6840671 | 3108 | 0.056 | 0.7130 | Yes | ||
| 14 | CDKN2B | 6020040 | 3172 | 0.053 | 0.7231 | Yes | ||
| 15 | ZFYVE9 | 6980288 7100017 | 3385 | 0.045 | 0.7232 | Yes | ||
| 16 | ACVR1B | 3610446 5570195 | 4444 | 0.024 | 0.6723 | No | ||
| 17 | MAP3K7 | 6040068 | 4923 | 0.018 | 0.6512 | No | ||
| 18 | SMAD2 | 4200592 | 5025 | 0.018 | 0.6502 | No | ||
| 19 | GDF15 | 4730017 | 5100 | 0.017 | 0.6505 | No | ||
| 20 | LTBP2 | 4850039 | 5262 | 0.016 | 0.6458 | No | ||
| 21 | HIPK2 | 6350647 | 6259 | 0.010 | 0.5947 | No | ||
| 22 | RGMB | 670504 4570450 | 6948 | 0.007 | 0.5594 | No | ||
| 23 | SMAD1 | 630537 1850333 | 7014 | 0.007 | 0.5576 | No | ||
| 24 | TGFB1 | 1940162 | 7046 | 0.007 | 0.5576 | No | ||
| 25 | ACVRL1 | 3290600 | 7216 | 0.006 | 0.5501 | No | ||
| 26 | CIDEA | 4560020 | 7827 | 0.004 | 0.5183 | No | ||
| 27 | SNX6 | 6200086 | 8232 | 0.003 | 0.4973 | No | ||
| 28 | LEFTY2 | 5670364 | 8277 | 0.003 | 0.4956 | No | ||
| 29 | GDF9 | 2350181 | 9100 | 0.001 | 0.4515 | No | ||
| 30 | TGFBR3 | 5290577 | 9722 | -0.001 | 0.4183 | No | ||
| 31 | ACVR2A | 6110647 | 10039 | -0.002 | 0.4018 | No | ||
| 32 | SMAD7 | 430377 | 11084 | -0.005 | 0.3468 | No | ||
| 33 | KLF10 | 4850056 | 11559 | -0.006 | 0.3229 | No | ||
| 34 | SOST | 1170195 | 11698 | -0.007 | 0.3172 | No | ||
| 35 | GDF5 | 510440 | 11820 | -0.007 | 0.3126 | No | ||
| 36 | FMOD | 540577 | 12108 | -0.009 | 0.2993 | No | ||
| 37 | ENG | 4280270 | 12160 | -0.009 | 0.2987 | No | ||
| 38 | GDF10 | 4850082 | 12576 | -0.011 | 0.2791 | No | ||
| 39 | IL17F | 670577 | 12744 | -0.012 | 0.2731 | No | ||
| 40 | FOXH1 | 2060180 | 12886 | -0.012 | 0.2686 | No | ||
| 41 | TGFBR1 | 1400148 4280020 6550711 | 13974 | -0.022 | 0.2157 | No | ||
| 42 | BMPR2 | 5340066 6960328 | 14260 | -0.026 | 0.2069 | No | ||
| 43 | FNTA | 70059 | 16448 | -0.109 | 0.1167 | No |