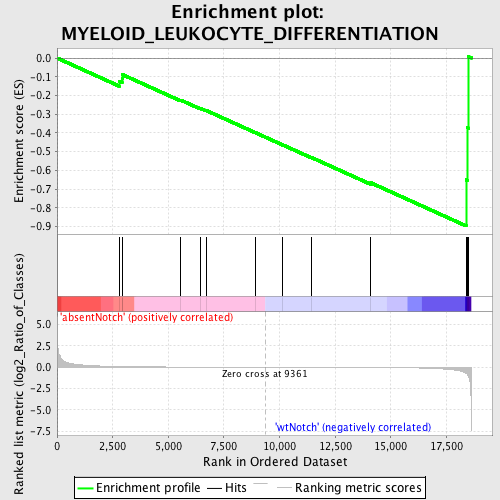
Profile of the Running ES Score & Positions of GeneSet Members on the Rank Ordered List
| Dataset | Set_03_absentNotch_versus_wtNotch.phenotype_absentNotch_versus_wtNotch.cls #absentNotch_versus_wtNotch.phenotype_absentNotch_versus_wtNotch.cls #absentNotch_versus_wtNotch_repos |
| Phenotype | phenotype_absentNotch_versus_wtNotch.cls#absentNotch_versus_wtNotch_repos |
| Upregulated in class | wtNotch |
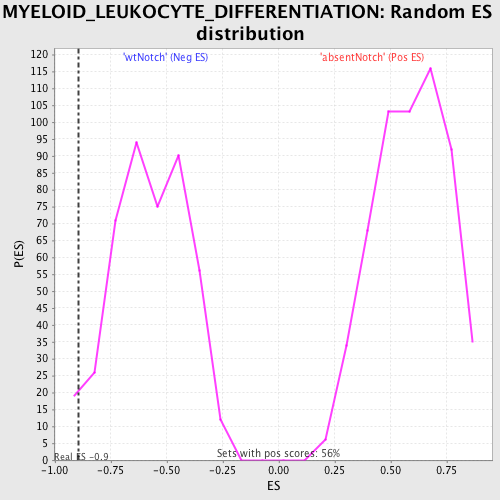
| GeneSet | MYELOID_LEUKOCYTE_DIFFERENTIATION |
| Enrichment Score (ES) | -0.8962822 |
| Normalized Enrichment Score (NES) | -1.5669528 |
| Nominal p-value | 0.015801355 |
| FDR q-value | 1.0 |
| FWER p-Value | 0.999 |
| PROBE | DESCRIPTION (from dataset) | GENE SYMBOL | GENE_TITLE | RANK IN GENE LIST | RANK METRIC SCORE | RUNNING ES | CORE ENRICHMENT | |
|---|---|---|---|---|---|---|---|---|
| 1 | RUNX1 | 3840711 | 2788 | 0.071 | -0.1252 | No | ||
| 2 | MMP9 | 580338 | 2921 | 0.064 | -0.1099 | No | ||
| 3 | CSF1 | 3120400 | 2934 | 0.064 | -0.0882 | No | ||
| 4 | CALCA | 5860167 | 5551 | 0.014 | -0.2241 | No | ||
| 5 | TM7SF4 | 60292 | 6423 | 0.009 | -0.2677 | No | ||
| 6 | IL31RA | 6770541 | 6697 | 0.008 | -0.2796 | No | ||
| 7 | IFI16 | 6520601 | 8901 | 0.001 | -0.3976 | No | ||
| 8 | CARTPT | 6660687 | 10152 | -0.002 | -0.4641 | No | ||
| 9 | IL4 | 6020537 | 11441 | -0.006 | -0.5313 | No | ||
| 10 | INHA | 6100102 | 14102 | -0.024 | -0.6660 | Yes | ||
| 11 | CDC42 | 1240168 3440278 4480519 5290162 | 18387 | -0.705 | -0.6500 | Yes | ||
| 12 | MYH9 | 3120091 4850292 | 18433 | -0.804 | -0.3715 | Yes | ||
| 13 | ACIN1 | 3390278 6350377 6620142 | 18499 | -1.092 | 0.0063 | Yes |