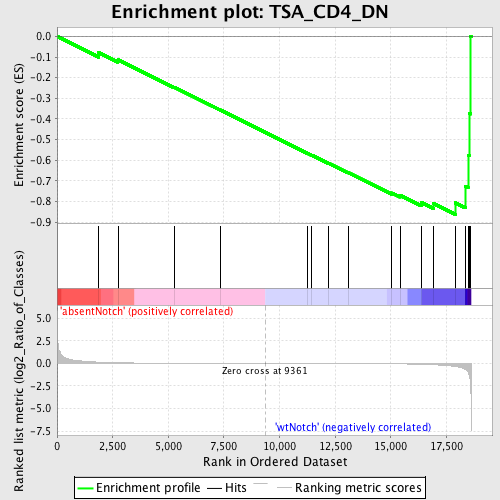
Profile of the Running ES Score & Positions of GeneSet Members on the Rank Ordered List
| Dataset | Set_03_absentNotch_versus_wtNotch.phenotype_absentNotch_versus_wtNotch.cls #absentNotch_versus_wtNotch.phenotype_absentNotch_versus_wtNotch.cls #absentNotch_versus_wtNotch_repos |
| Phenotype | phenotype_absentNotch_versus_wtNotch.cls#absentNotch_versus_wtNotch_repos |
| Upregulated in class | wtNotch |
| GeneSet | TSA_CD4_DN |
| Enrichment Score (ES) | -0.8625763 |
| Normalized Enrichment Score (NES) | -1.5775269 |
| Nominal p-value | 0.012578616 |
| FDR q-value | 0.4687479 |
| FWER p-Value | 1.0 |
| PROBE | DESCRIPTION (from dataset) | GENE SYMBOL | GENE_TITLE | RANK IN GENE LIST | RANK METRIC SCORE | RUNNING ES | CORE ENRICHMENT | |
|---|---|---|---|---|---|---|---|---|
| 1 | CX3CR1 | 1690577 | 1868 | 0.140 | -0.0778 | No | ||
| 2 | CD247 | 3800725 5720136 | 2736 | 0.074 | -0.1125 | No | ||
| 3 | OGDH | 3840333 6350100 | 5273 | 0.016 | -0.2463 | No | ||
| 4 | WNT4 | 4150619 | 7335 | 0.006 | -0.3562 | No | ||
| 5 | ENTPD2 | 4590739 | 11232 | -0.005 | -0.5648 | No | ||
| 6 | WNT7A | 1170315 | 11450 | -0.006 | -0.5755 | No | ||
| 7 | RARB | 430139 1410138 | 12215 | -0.009 | -0.6152 | No | ||
| 8 | NOTCH2 | 2570397 | 13080 | -0.014 | -0.6594 | No | ||
| 9 | FGF18 | 1410168 2190706 | 15047 | -0.041 | -0.7584 | No | ||
| 10 | METAP2 | 1570441 4010026 4850204 | 15413 | -0.053 | -0.7693 | No | ||
| 11 | LAT | 3170025 | 16367 | -0.102 | -0.8040 | No | ||
| 12 | CD3E | 3800056 | 16914 | -0.148 | -0.8095 | Yes | ||
| 13 | SLC3A2 | 5270358 | 17903 | -0.348 | -0.8062 | Yes | ||
| 14 | CD3D | 2810739 | 18351 | -0.648 | -0.7252 | Yes | ||
| 15 | IL2RA | 6620450 | 18476 | -0.968 | -0.5751 | Yes | ||
| 16 | ICAM1 | 6980138 | 18523 | -1.266 | -0.3724 | Yes | ||
| 17 | NOTCH1 | 3390114 | 18588 | -2.330 | 0.0015 | Yes |

