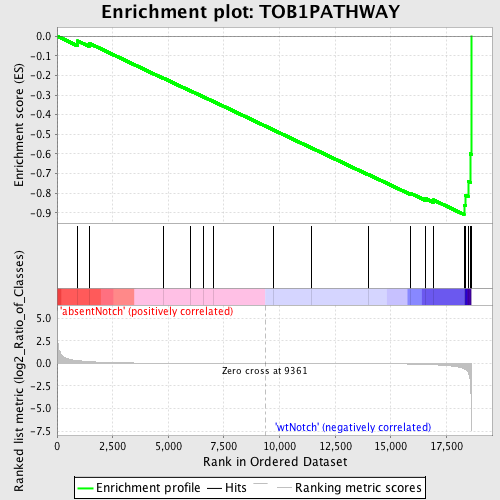
Profile of the Running ES Score & Positions of GeneSet Members on the Rank Ordered List
| Dataset | Set_03_absentNotch_versus_wtNotch.phenotype_absentNotch_versus_wtNotch.cls #absentNotch_versus_wtNotch.phenotype_absentNotch_versus_wtNotch.cls #absentNotch_versus_wtNotch_repos |
| Phenotype | phenotype_absentNotch_versus_wtNotch.cls#absentNotch_versus_wtNotch_repos |
| Upregulated in class | wtNotch |
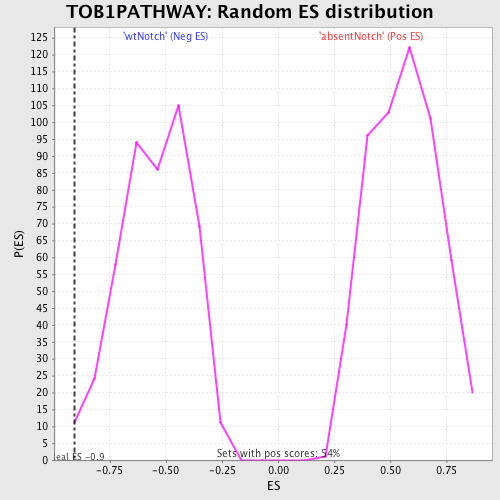
| GeneSet | TOB1PATHWAY |
| Enrichment Score (ES) | -0.9082048 |
| Normalized Enrichment Score (NES) | -1.6632961 |
| Nominal p-value | 0.0043668123 |
| FDR q-value | 0.17690344 |
| FWER p-Value | 0.881 |
| PROBE | DESCRIPTION (from dataset) | GENE SYMBOL | GENE_TITLE | RANK IN GENE LIST | RANK METRIC SCORE | RUNNING ES | CORE ENRICHMENT | |
|---|---|---|---|---|---|---|---|---|
| 1 | TOB1 | 4150138 | 922 | 0.306 | -0.0246 | No | ||
| 2 | CD28 | 1400739 4210093 | 1442 | 0.195 | -0.0366 | No | ||
| 3 | TGFB2 | 4920292 | 4792 | 0.020 | -0.2150 | No | ||
| 4 | IL2 | 1770725 | 5977 | 0.011 | -0.2777 | No | ||
| 5 | IFNG | 5670592 | 6573 | 0.008 | -0.3091 | No | ||
| 6 | TGFB1 | 1940162 | 7046 | 0.007 | -0.3339 | No | ||
| 7 | TGFBR3 | 5290577 | 9722 | -0.001 | -0.4776 | No | ||
| 8 | IL4 | 6020537 | 11441 | -0.006 | -0.5695 | No | ||
| 9 | TGFBR1 | 1400148 4280020 6550711 | 13974 | -0.022 | -0.7039 | No | ||
| 10 | TGFB3 | 1070041 | 15898 | -0.074 | -0.8012 | No | ||
| 11 | TOB2 | 1240465 | 16567 | -0.117 | -0.8276 | No | ||
| 12 | CD3E | 3800056 | 16914 | -0.148 | -0.8341 | No | ||
| 13 | CD3G | 2680288 | 18293 | -0.577 | -0.8611 | Yes | ||
| 14 | CD3D | 2810739 | 18351 | -0.648 | -0.8113 | Yes | ||
| 15 | IL2RA | 6620450 | 18476 | -0.968 | -0.7390 | Yes | ||
| 16 | TGFBR2 | 1780711 1980537 6550398 | 18569 | -1.770 | -0.5995 | Yes | ||
| 17 | TRB@ | 3940292 | 18616 | -7.377 | 0.0000 | Yes |